


Solana price is flashing a daily bullish divergence while holding key support at $131, suggesting early signs of strength and the possibility of a short-term reversal toward higher resistance levels.
Summary
- Momentum shift emerges as Solana steadies at a long-tested support zone
- Market behavior reflects early accumulation after extended sell pressure
- Divergence hints that downside exhaustion may be forming beneath recent lows
Solana’s (SOL) latest price action is showing encouraging signals after an extended period of downside pressure. A clear bullish divergence has formed on the daily chart, hinting that momentum may be shifting back toward buyers.
With price holding a major support level and several indicators showing alignment, and with Wormhole’s new Sunrise DeFi platform launching on Solana and debuting Monad’s MON as its first listing, the current structure suggests that Solana may be preparing for a relief move.
Solana price key technical points
- Daily bullish divergence forming between price and RSI
- Major support at $131 continues to act as a reaction zone
- Key resistance lies at the value area low and later at $167

Solana is currently printing one of the most reliable early-reversal signals in technical analysis: a bullish divergence on the daily time frame. While price has recently formed a lower low, the RSI has created a higher low. This separation between momentum and price often suggests that sellers are losing strength even as price continues drifting downward.
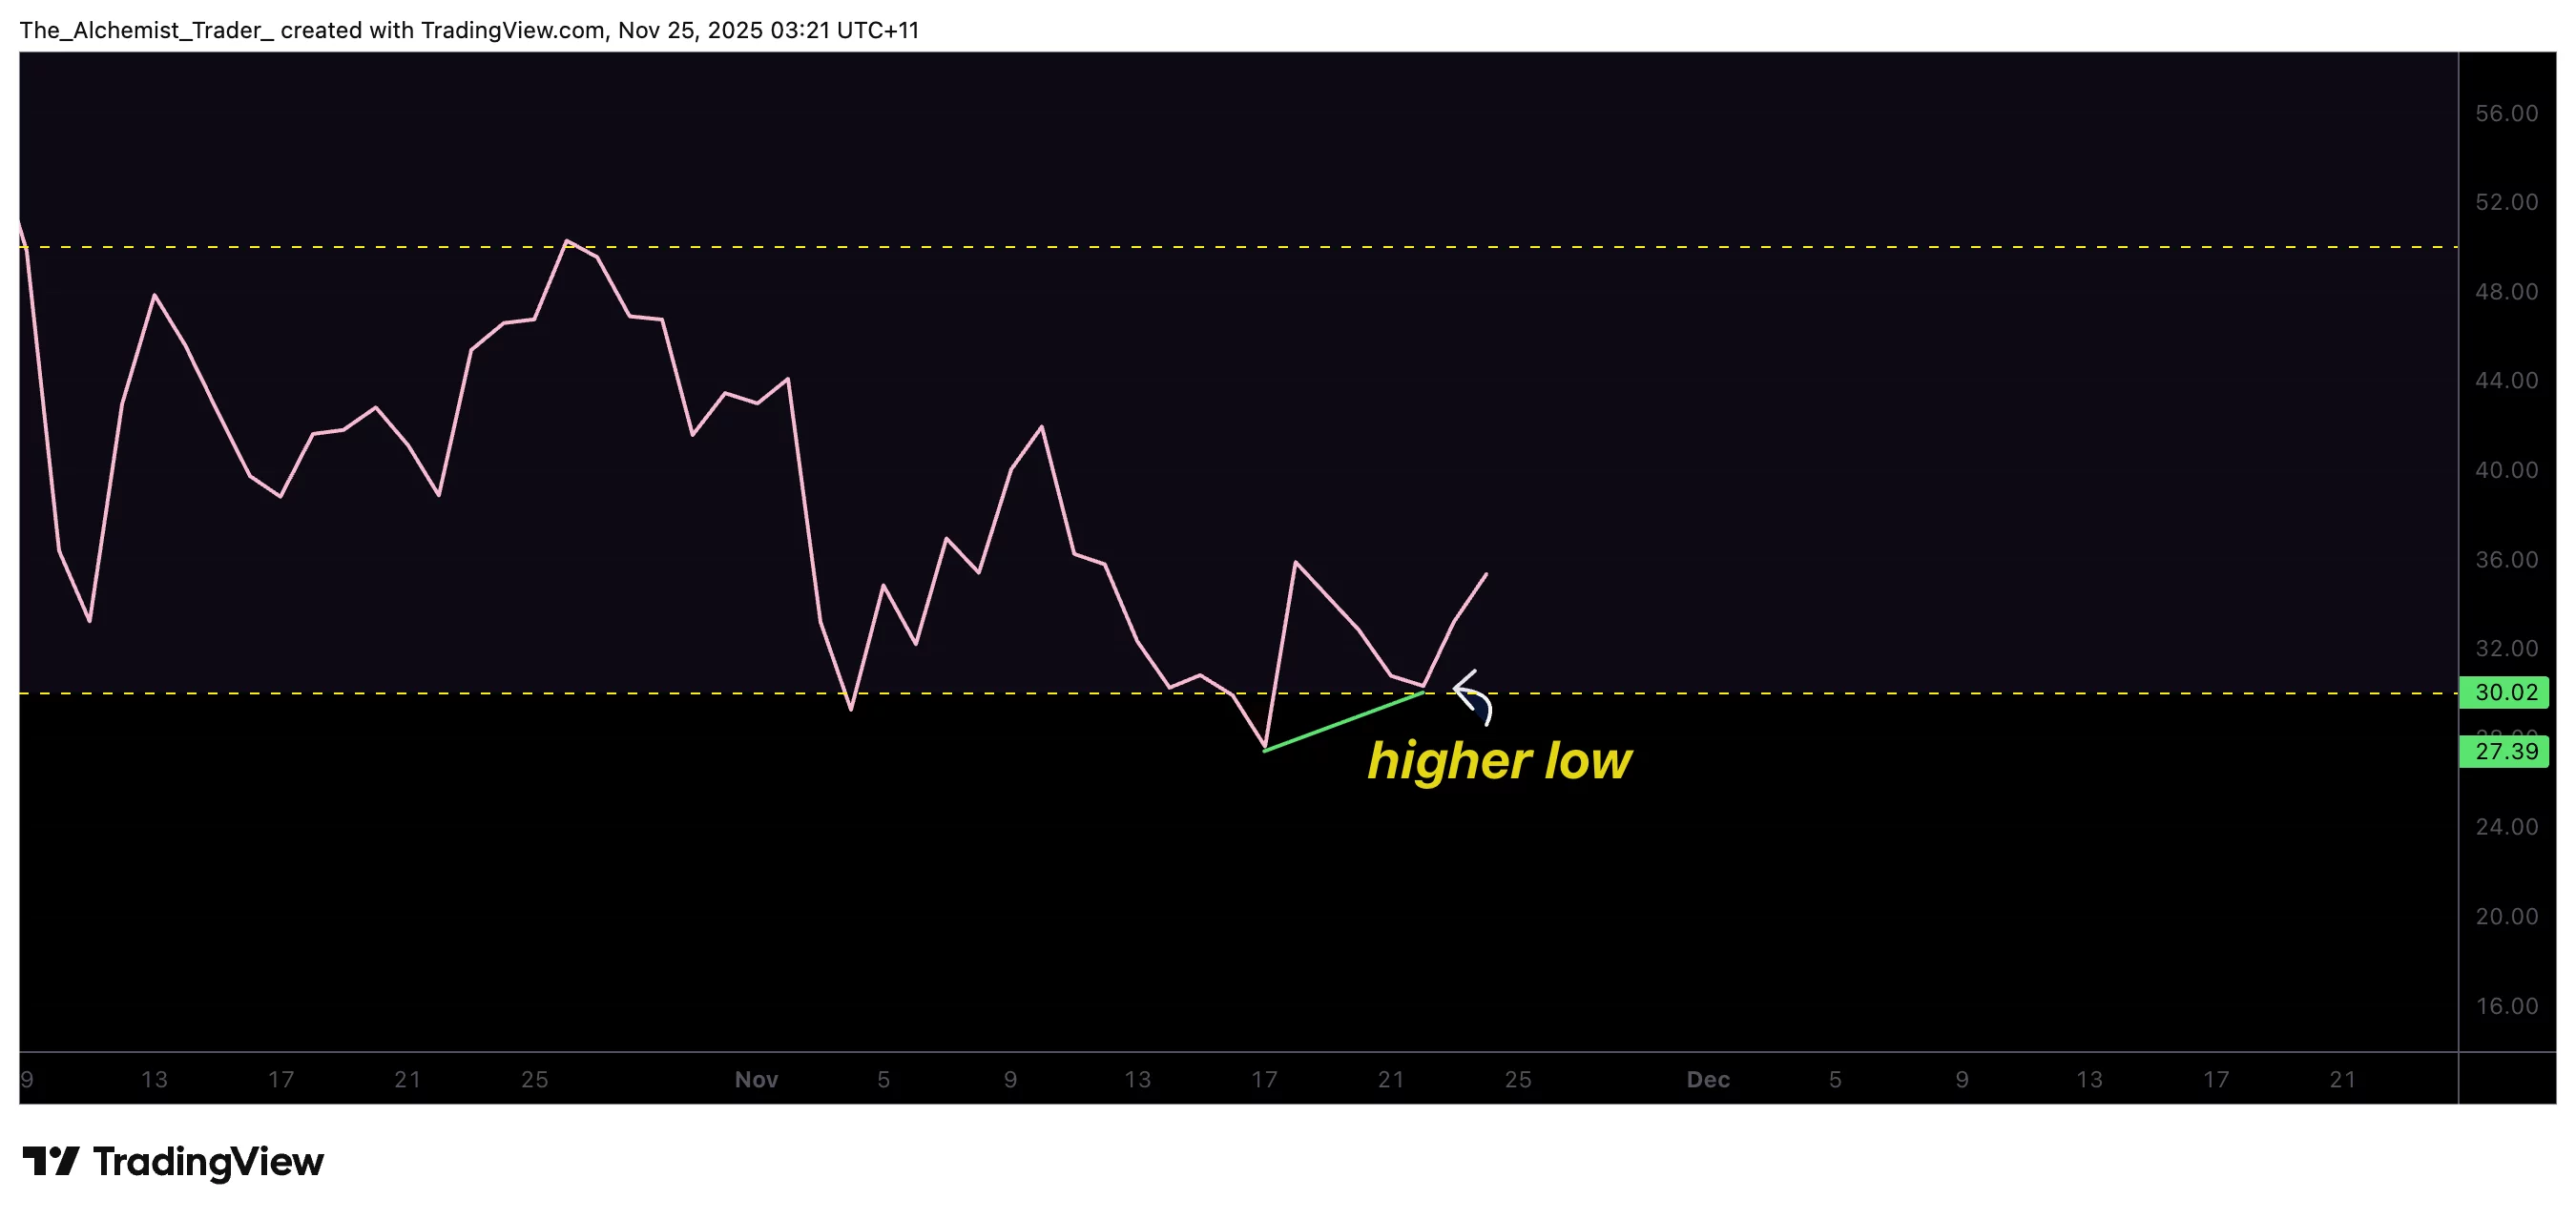
The $131 region has become a focal point in recent sessions. This area has held as support multiple times, with price hovering above it for several days. Such behavior typically indicates the market is entering an accumulation phase where buyers absorb selling pressure before attempting a shift in direction.
If this support continues to hold, the next key level to watch is the value area low. Reclaiming this region would signal that buying pressure is returning, and that Solana may be preparing for a rotation toward the next significant resistance at $167. This level aligns with high-time-frame resistance and has historically acted as a significant decision point for trend continuation or rejection.
With new Solana ETFs from Grayscale and VanEck launching amid rising volatility, market flows may also help shape how the price reacts at this key level.
Price action and momentum indicators are now converging, suggesting a short-term reversal is becoming more likely. Bullish divergences often appear at the end of aggressive sell-offs, and Solana’s recent behavior fits this pattern. While confirmation is still pending, early signals suggest a potential shift in market sentiment.
Price action
If Solana maintains support at $131 and activates the bullish divergence, a move toward $167 may follow. A loss of support would delay the reversal and return the asset to a bearish continuation phase.