


BNB price is eyeing a retest of a key support trendline as it continues to remain in a downtrend. A break below the said pattern could trigger a 15% drop in BNB price ahead.
Summary
- BNB price fell 11% below its December high.
- Declining transactions and futures activity on the network continue to weigh on investor sentiment for the token.
- BNB is eyeing a break below a key trendline support, which could lead to a deeper correction over the coming days.
According to data from crypto.news, BNB (BNB) price dropped 11% down from its monthly high of $923.8 to a low of $821.7 last Friday, Dec. 19. While the 4th leading cryptocurrency by market cap has since recovered slightly to $849.2 at press time, it still remains 38% below its year-to-date high reached in October.
BNB price has declined as user activity on the BNB Chain continues to slow down. Per data from BscScan, the number of transactions on the blockchain has dropped nearly 47% since its October highs to 16.1 million at press time.
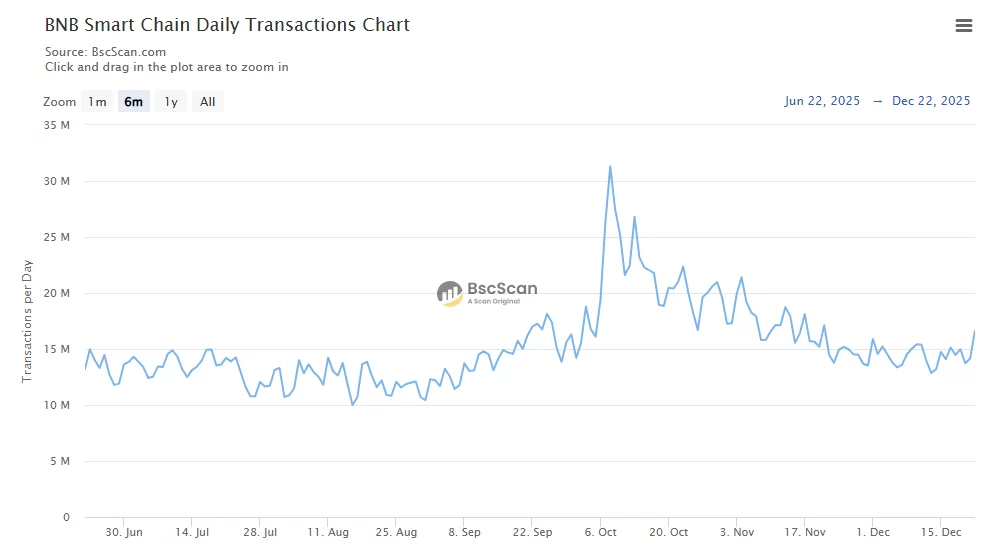
A drop in transactions over a network typically indicates lower engagement from users and developers, which in turn could reduce demand for the token among investors.
Further, derivative traders have also been unwinding their positions in the token. Data from CoinGlass shows BNB futures open interest has dropped from $2.97 billion in October to $1.27 billion at the time of writing.
Such a steep decline in open interest suggests that traders are actively closing their positions and reducing leveraged exposure, which could continue to put pressure on BNB prices at least in the short term.
The bearish on-chain stats come even as BNB’s longer-term fundamentals continue to improve. The BNB Chain is seeing greater adoption in the real-world asset market. Notably, BlackRock’s tokenized treasury fund is now supported on the network. Such a development increases institutional demand and enhances the overall credibility of the ecosystem.
Meanwhile, BNB’s auto-burn mechanism has also been quietly and consistently reducing its circulating supply, driving scarcity and strengthening the longer-term value proposition for BNB price.
On the daily chart, BNB price is approaching a key support trendline that has historically acted as a springboard for rebounds each time it was tested since April this year.
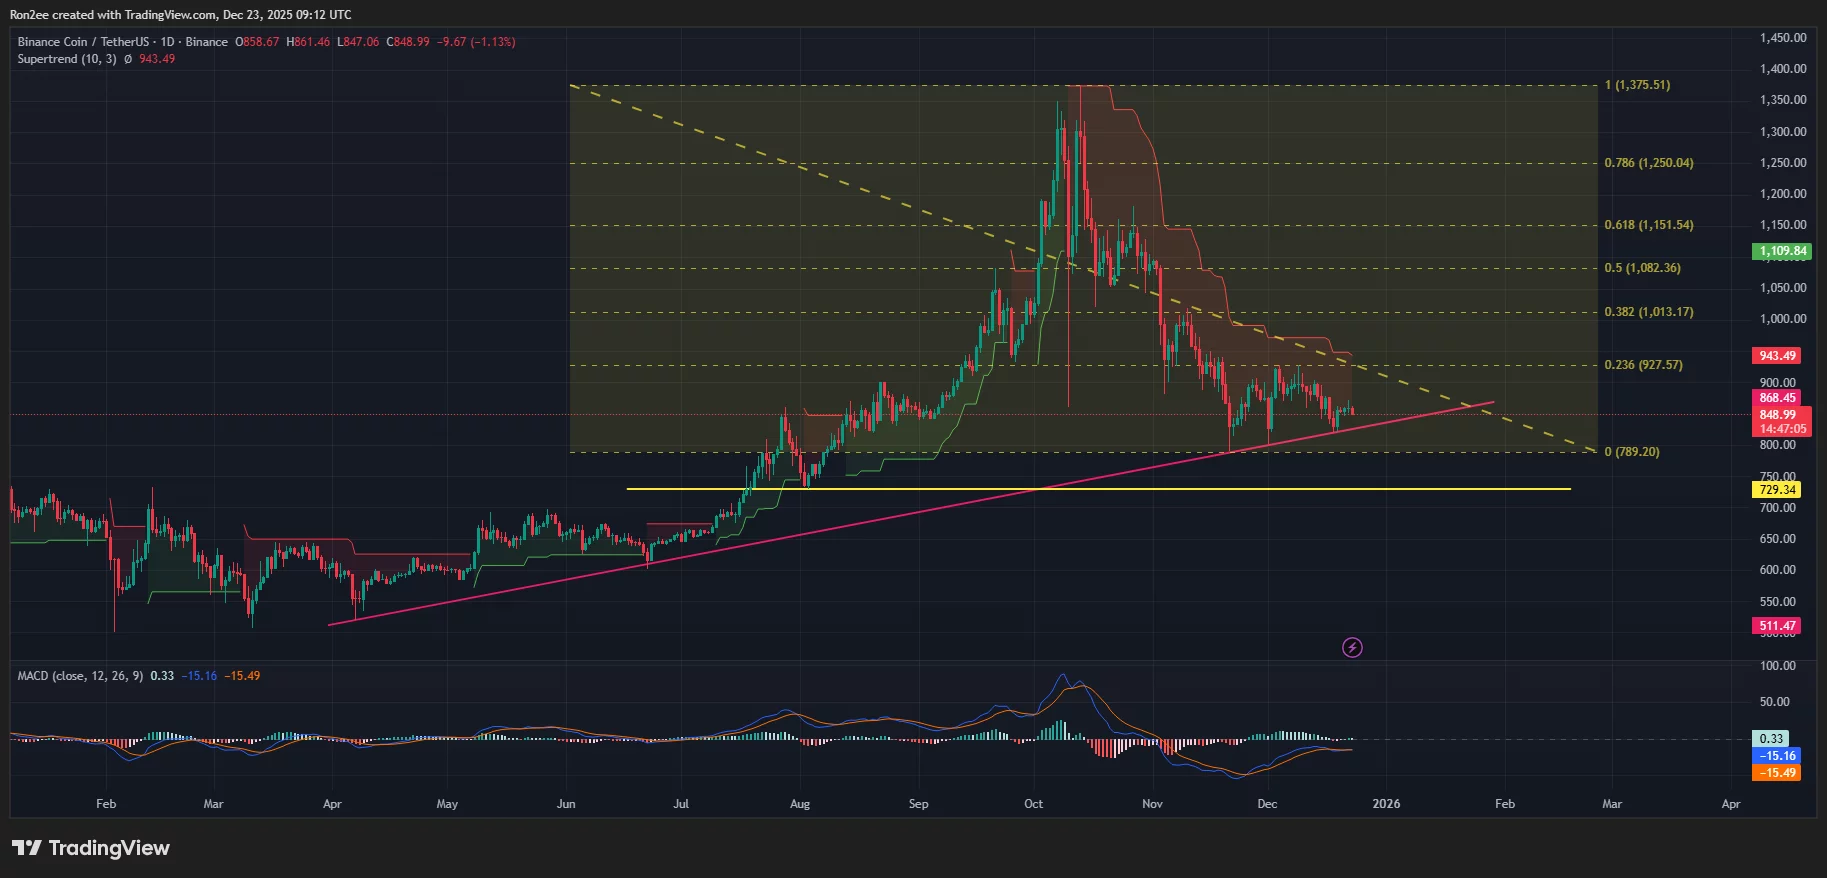
At press time, BNB price is just 2.7% shy of dipping below this crucial support trendline.
Technical indicators are also suggesting a bearish outlook. The MACD lines have dropped below the zero level, a telltale sign of weakening momentum. Meanwhile, BNB price has also slipped below the Supertrend line, which has flashed red and indicates that the bearish trend remains intact.
Hence, a break below the support threshold could push BNB price down toward $729.3, its August second low, and a level that stands nearly 15% below the current price.
On the contrary, $927.5, which aligns with the 23.6% Fibonacci retracement level, acts as the key resistance to watch. A strong break above this could signal a shift in momentum and potentially pave the way for a recovery phase in the upcoming sessions.
Disclosure: This article does not represent investment advice. The content and materials featured on this page are for educational purposes only.