




Hyperliquid’s HYPE token fell about 7.5% over the past week, retreating from $83.55 to around $78.70 as legal concerns and weaker technical momentum weighed on its recent rally.
Summary
- HYPE price has fallen 7.5% since Sep. 10 after setting a record high near $89.
- 4-hour Supertrend resistance sits at $82.30, keeping the short-term structure bearish.
- Bollinger Band support at $75.83 remains the main level protecting the broader uptrend.
- Hyperliquid reportedly bought and burned 36,720 HYPE worth $2.84 million within 24 hours.
HYPE price retreats from record high
Hyperliquid (HYPE) price traded near $78.70 on Sep. 16 after falling from an opening price of $83.55 on Sep. 10. The move represented a weekly decline of about 7.5%, although the token remained well above its August trading range.
The correction followed HYPE’s rally to a record high near $89 in early September. Daily candles show that buyers repeatedly failed to hold prices above the $88 area before sellers pushed the token below $82.
HYPE briefly dropped toward $76 on Sep. 16 before rebounding to around $78.70. The recovery showed that buyers remained active near the lower end of the week’s range, but price had yet to reclaim the technical levels that would signal a stronger reversal.
The pullback also followed federal charges against two former Robinhood engineers accused of using confidential listing information to trade perpetual futures on Hyperliquid.
Separate federal complaints alleged that Huaisong “Jerry” Xiang and Hefu Chai traded ahead of Robinhood’s public announcements. Prosecutors said each defendant earned more than $50,000 through the alleged activity. The allegations concern the individuals’ conduct and do not accuse Hyperliquid or its developers of participating in the scheme.
Short-term HYPE structure remains bearish
The 4-hour chart shows HYPE trading below the Supertrend indicator, which had shifted to resistance at $82.30. The indicator will continue to favor sellers unless the token closes above that level and holds it as support.
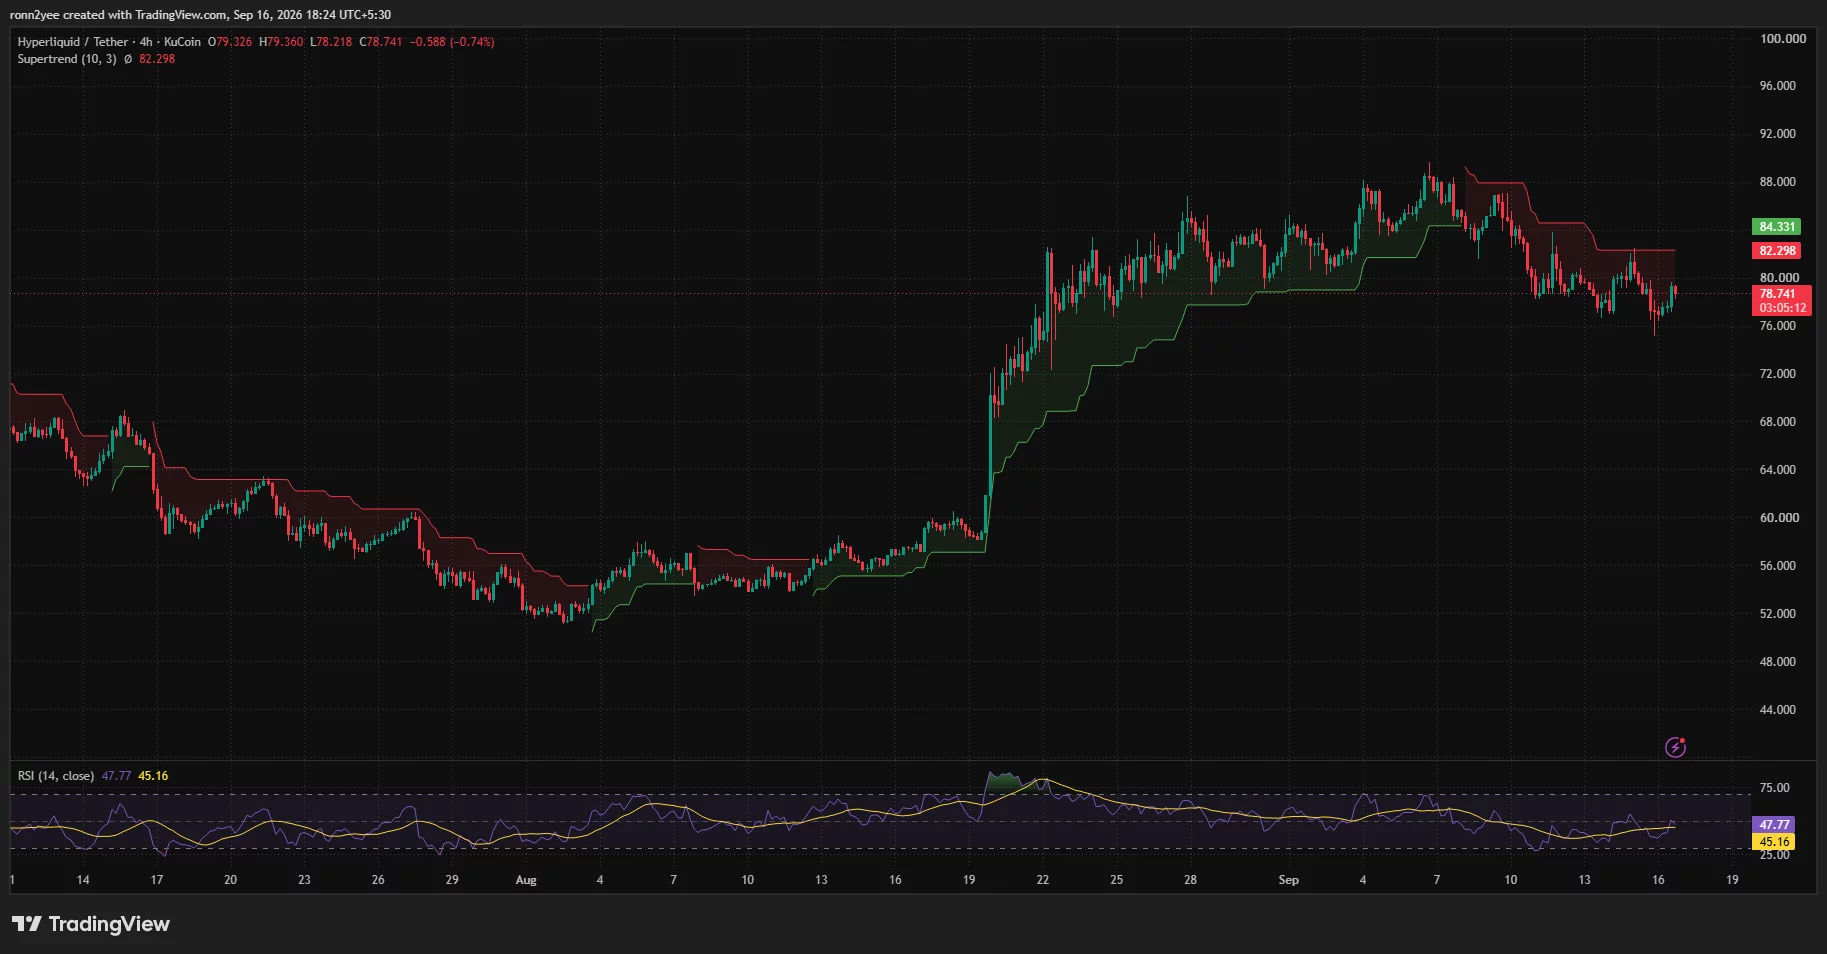
HYPE’s 4-hour Relative Strength Index stood at 47.77, while its RSI-based average was 45.16. The readings place momentum near neutral territory after recovering from a recent approach toward oversold conditions.
Price action has also formed a series of lower highs since the Sep. 7 peak. A rebound toward $80 stalled before reaching the Supertrend line, suggesting that sellers continue to defend rallies.
The $80 psychological level is the first barrier for buyers. A sustained move above it could allow HYPE to test the $82.18–$82.30 area, where the daily Bollinger Band midpoint and 4-hour Supertrend resistance converge.
A close above that zone would weaken the bearish short-term setup and expose $84.30, followed by the upper Bollinger Band near $88.53. The record area between $89 and $90 would become relevant only if HYPE clears those intermediate levels.
Daily Bollinger support protects the larger uptrend
The daily chart presents a less bearish picture than the 4-hour setup. HYPE remained above the lower Bollinger Band at $75.83 despite trading below the middle band at $82.18.
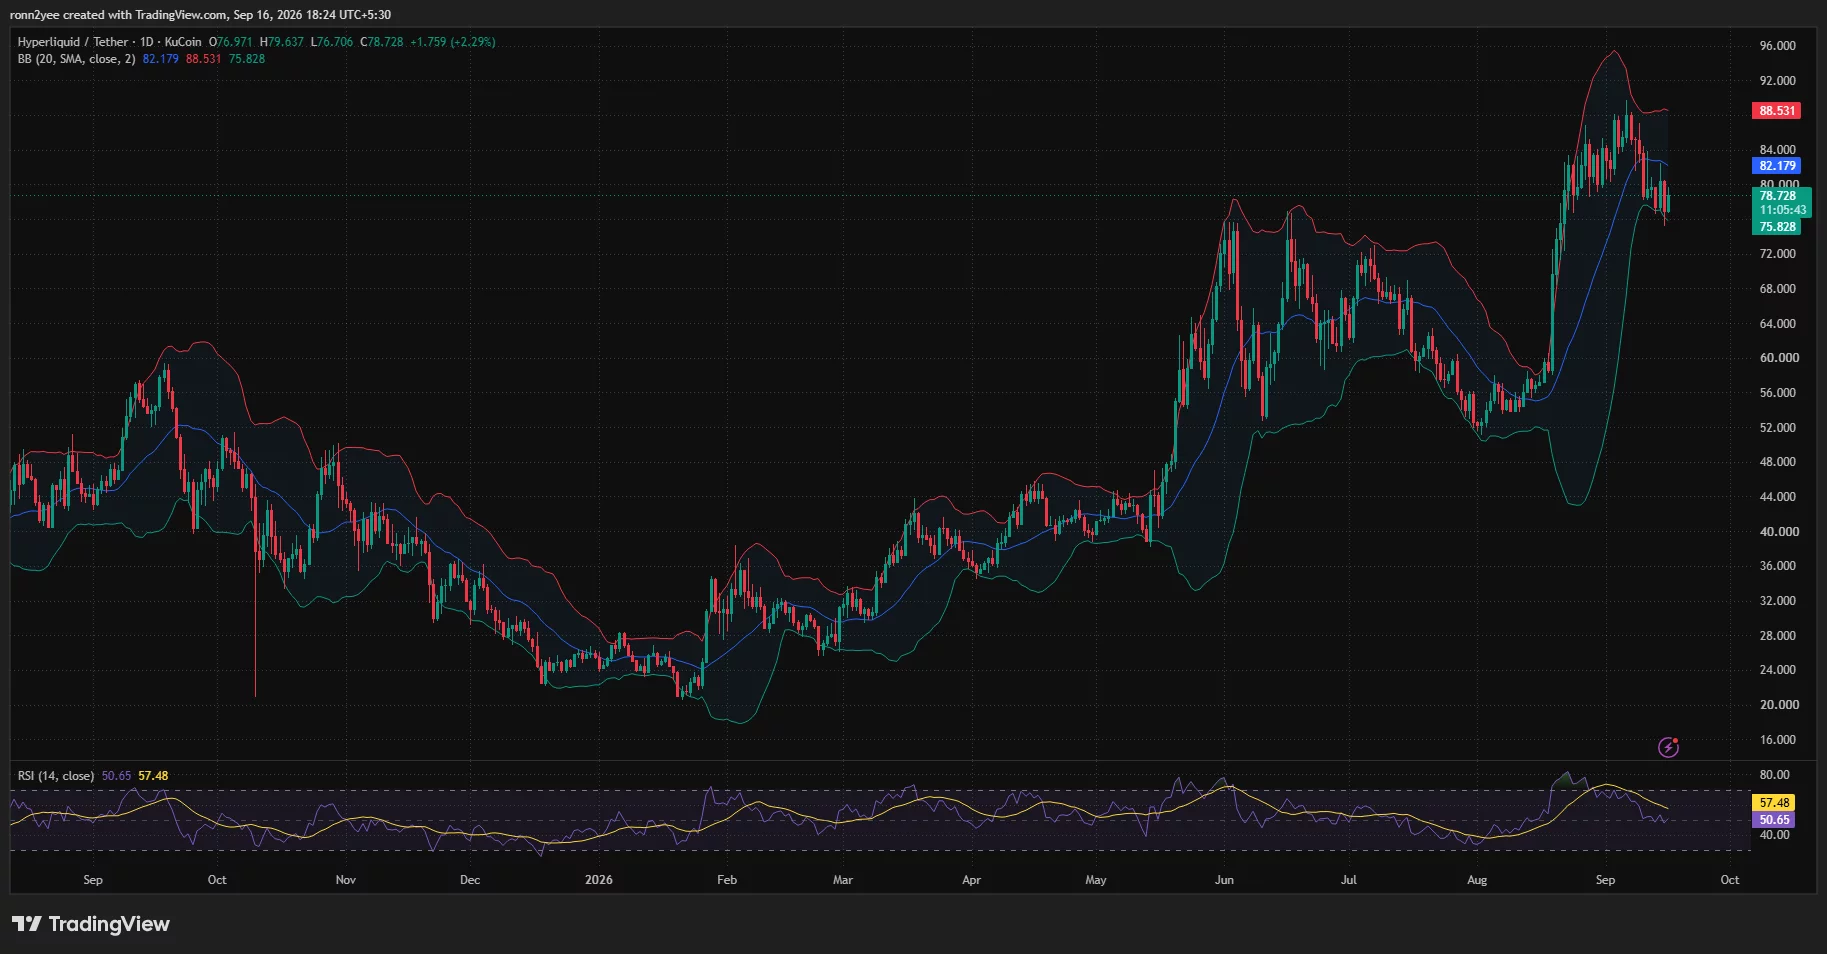
Daily RSI stood at 50.65, down from an overbought reading reached during the early-September rally. The indicator’s average remained higher at 57.48, showing that momentum has cooled faster than its recent trend.
A daily close below $75.83 would mark a more serious technical breakdown. The next visible support zone lies around $72, where HYPE consolidated before its late-August advance. A deeper correction could then bring the $68–$70 region back into focus.
The wider chart still shows a sequence of higher lows from the August bottom near $51. HYPE would therefore need to lose the mid-$70s support area before the larger recovery structure faces a clearer threat.
Holding $75.83 while reclaiming $82.30 would instead support a consolidation scenario between the lower and middle Bollinger Bands.
Liquidation map places liquidity near $80
CoinGlass’ 24-hour liquidation heatmap shows a dense liquidity cluster between roughly $78.40 and $78.90, close to HYPE’s current price. A second concentration appears between $79.70 and $80.50.
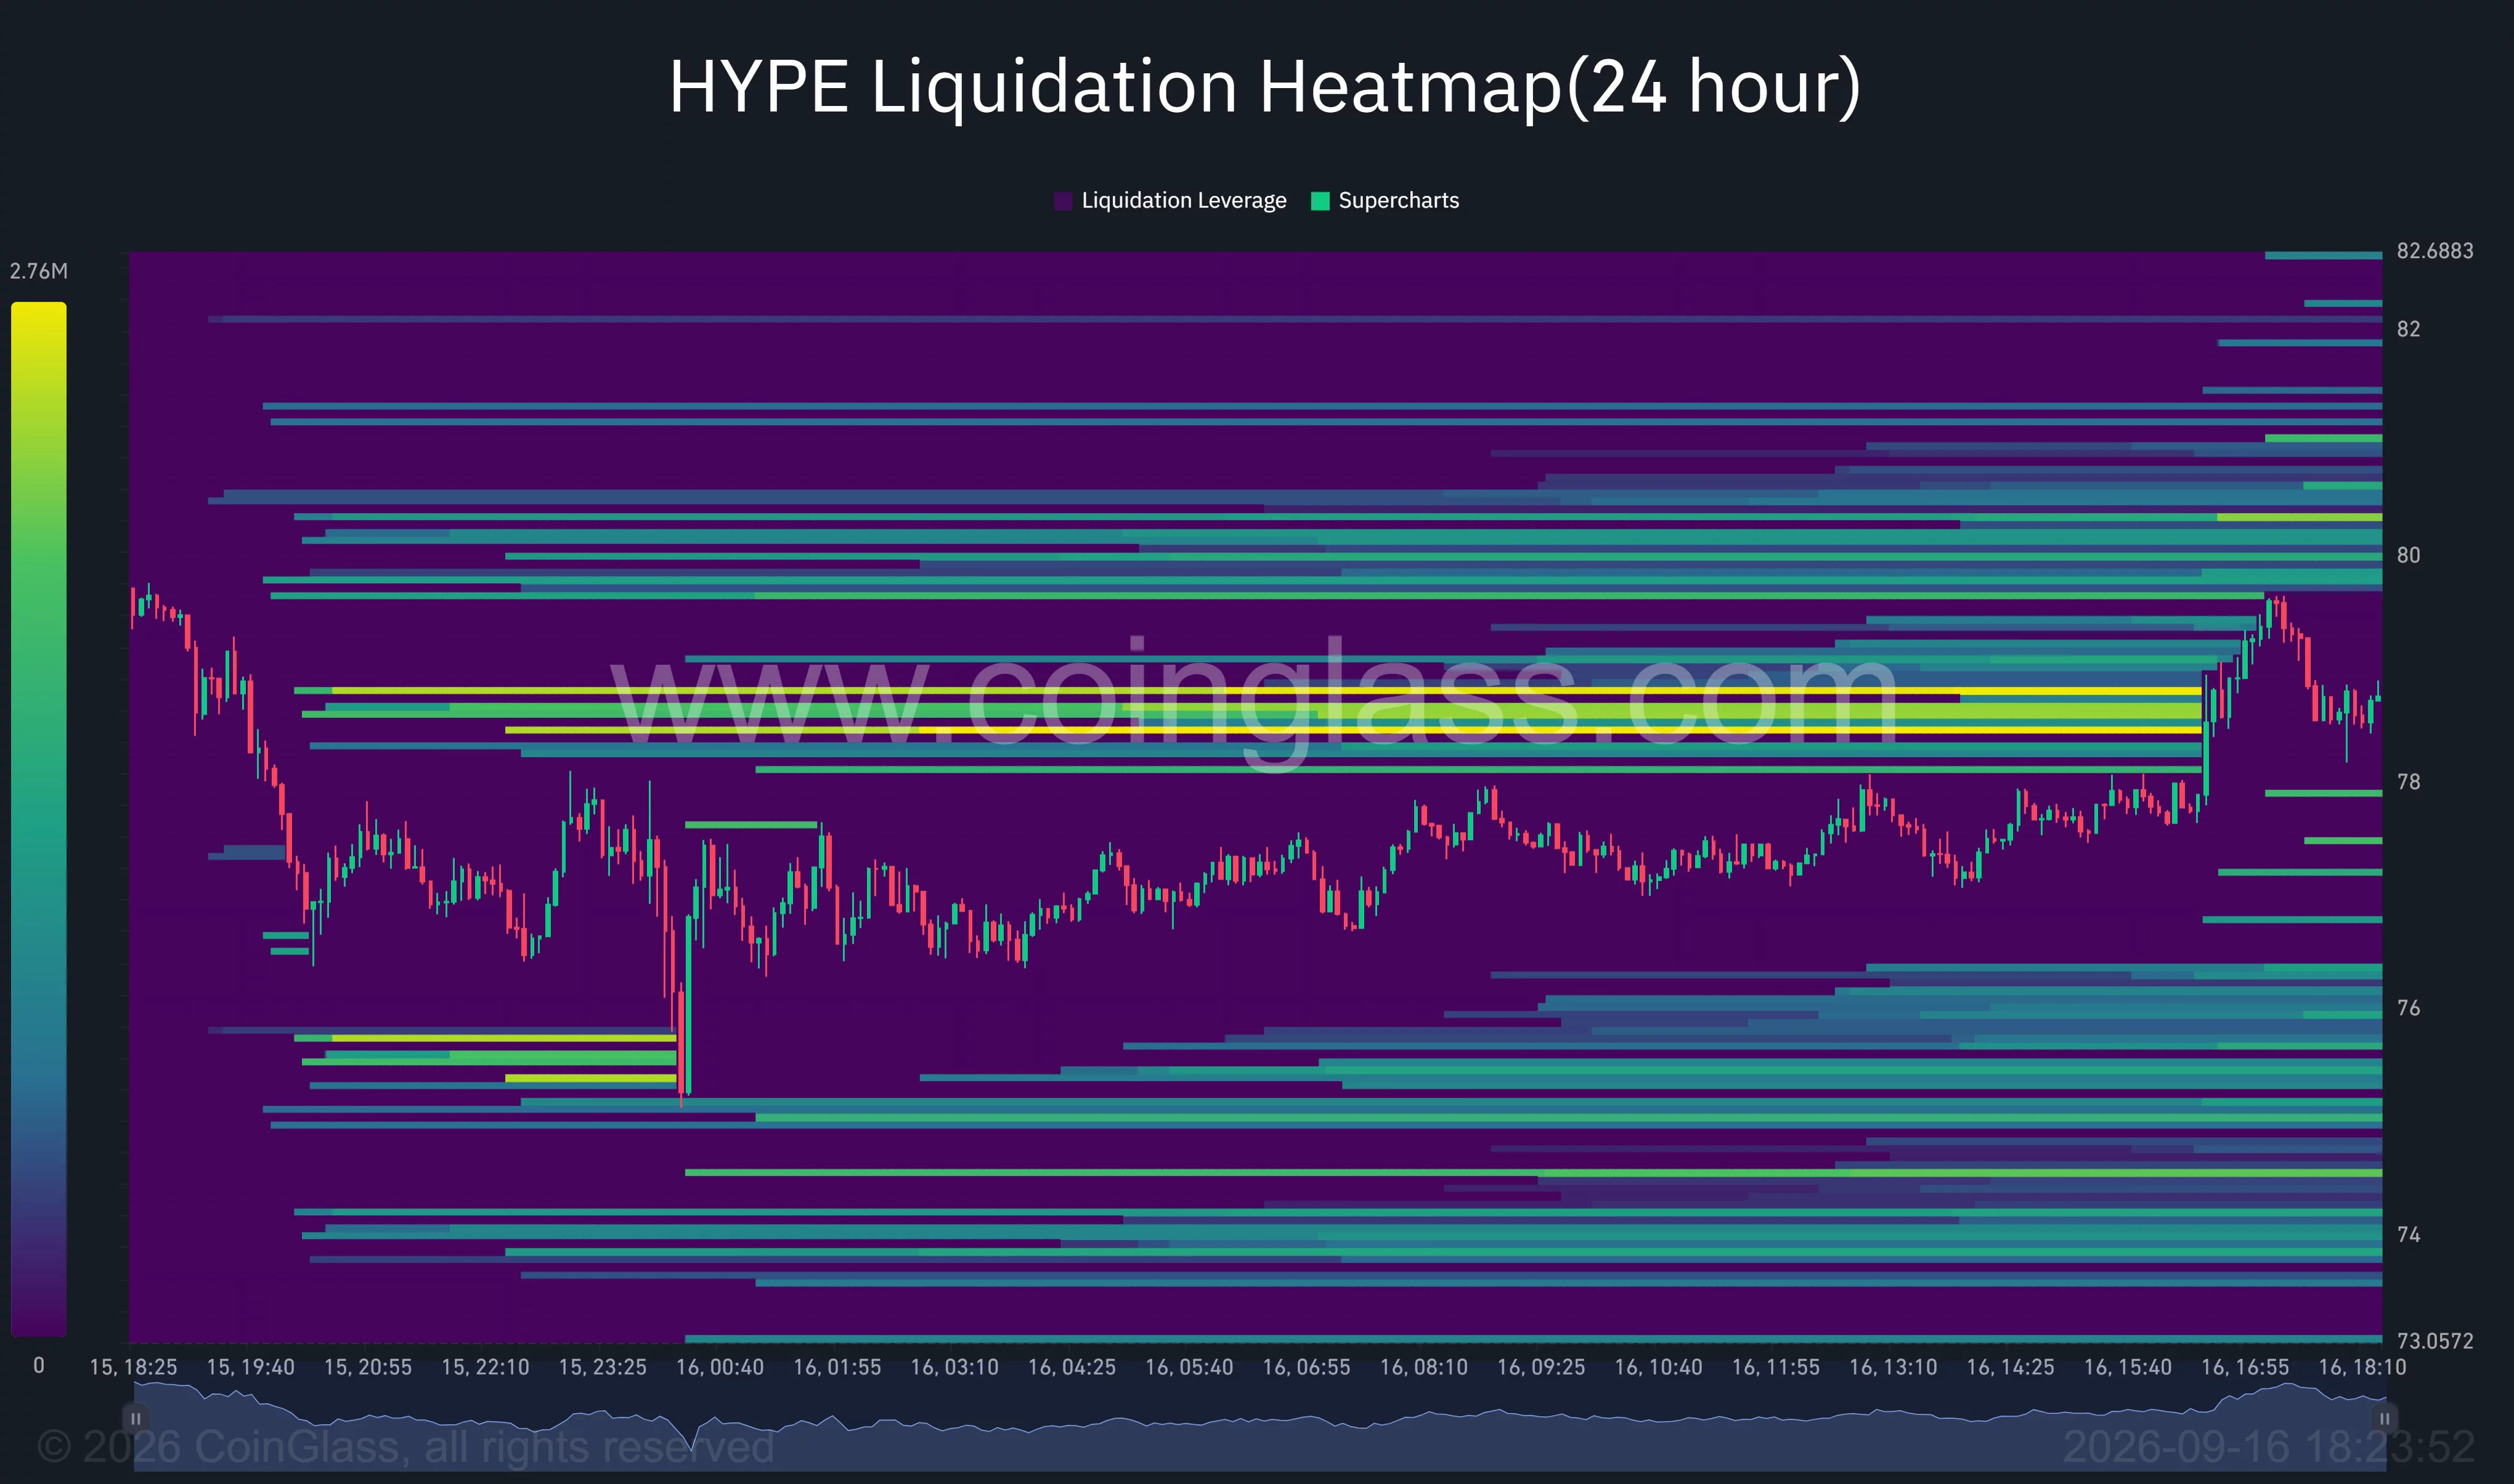
Those bands could attract price during a rebound because leveraged positions tend to accumulate around crowded levels. The heatmap does not show that all positions in those zones have already been liquidated; it identifies areas where forced closures could increase if price reaches them.
Above the market, the strongest nearby liquidity sits around $80.30. A move through that level could accelerate toward $81 and $82 as short positions face pressure.
Liquidity is also visible below price around $75–$76, aligning with the daily lower Bollinger Band. A break under $77 could therefore expose HYPE to a sweep of leveraged long positions before buyers attempt another recovery.
Token burns offer support during the correction
Onchain Lens reported that Hyperliquid bought and burned 36,720 HYPE worth about $2.84 million during a 24-hour period, at a volume-weighted average price of $77.31.
The account said lifetime burns had reached 48.67 million HYPE, valued at approximately $3.78 billion and equal to 4.87% of the token’s maximum supply. It also reported $2.14 million in rolling 24-hour fees and $2.07 million in HYPE-directed revenue.
The buyback mechanism may absorb part of the available sell-side supply, but the charts show that it has not yet restored bullish short-term momentum.
For HYPE, the immediate setup depends on whether buyers can defend $75.83 and push the price above $82.30. Remaining below that resistance would leave the token vulnerable to further consolidation, while a confirmed reclaim could reopen a path toward $84.30 and $88.53.
Disclosure: This article does not represent investment advice. The content and materials featured on this page are for educational purposes only.
