Bitcoin continues to show resilience near all-time highs, and new on-chain data suggests there may still be room for the rally to extend.
The price may still rise before hitting significant resistance, according to a July 17 analysis by CryptoQuant contributor Darkfost. The focus is on a subset of investors who purchased Bitcoin (BTC) in the past few months, referred to as short-term holders.
A common way to track their behavior is through the Market Value to Realized Value ratio, which compares the market price of Bitcoin to the average price paid by these holders. The MVRV ratio is used to gauge how much profit short-term holders are sitting on.
Historically, when the unrealized profit of these short-term holders climbs to around 35%, it tends to lead to selling. That usually brings about a short-term pullback. In past cycles, this threshold lined up with an MVRV reading of around 1.35.
Currently, that number is closer to 1.15. In simple terms, short-term holders are not yet sitting on the kind of profits that have triggered major sell-offs in the past. This gives Bitcoin room to increase by an additional 20% to 25% before hitting that familiar tipping point.
This shift can be largely attributed to the fact that the realized price, or the average price paid by short-term holders, recently crossed $100,000 for the first time. As of this week, it’s already above $102,000. That higher base makes it harder to reach the same level of unrealized profits as quickly as in previous cycles, giving Bitcoin more breathing room.
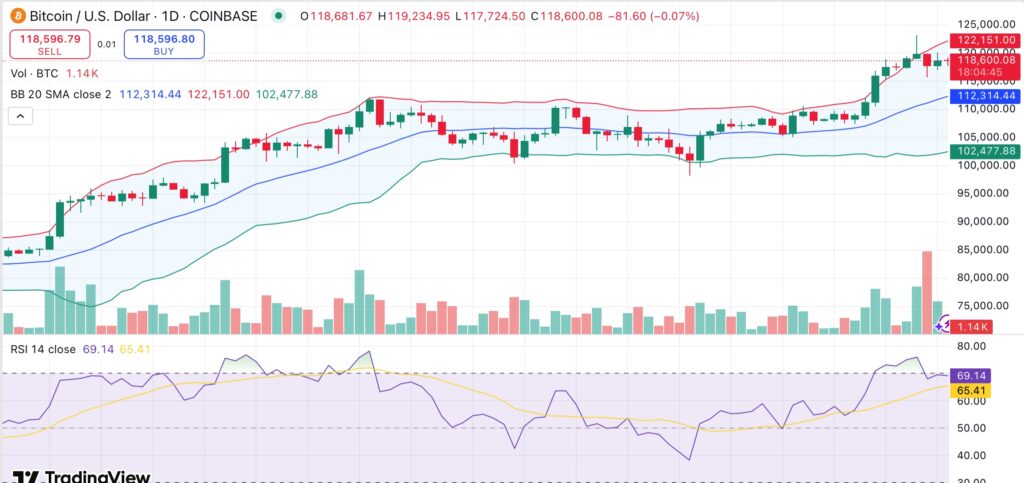
Bitcoin has recovered well after slipping following the latest U.S. inflation report. It dropped to around $116,000 but has since bounced back. At the time of writing, it’s trading at about $118,600, only 3.6% percent below its record high around $123,000, set on July 14.
Despite the price recovery, activity in the market has slowed. Daily trading volume is down over 22%, indicating cooling momentum. In the derivatives market, data from Coinglass shows a 16.3% decline in volume and a slight fall in open interest. This suggests that traders are taking a more cautious approach in the near term.
From a technical standpoint, Bitcoin is consolidating just below the upper Bollinger Band which is around $122,151. At 69, the relative strength index is just below the overbought threshold, indicating strong but not overheated momentum. A bullish bias is still supported by the majority of oscillators, such as the momentum and MACD indicators.

Moving averages from the 10-day to 200-day timeframes are trending higher, reinforcing the view that BTC remains in a firmly bullish structure. Currently at around $116,464, the 10-day exponential moving average has supported recent declines and may act as a short-term floor if volatility returns.
A breakout above $120,000 might reopen the path toward retesting the $123,000 high if bulls recover volume support. On the downside, if $116,000 is not held, attention will turn to the mid-Bollinger range, which is approximately $112,000.


