Shiba Inu price could be on the verge of a strong bullish breakout as the daily burn rate rose and the total value locked in Shibarium rose.
Shiba Inu (SHIB) rose to $0.00001270 on Wednesday, a few points above the year-to-date low of $0.00010.
Third-party data shows that the total value locked in the Shibarium network has increased, crossing $3 million for the first time since March 29. This is a notable recovery from the year-to-date low of $1.8 million.
The ongoing recovery has been driven by several dApps within the network. ShibaSwap’s assets climbed 32% in the last 30 days to $1.4 million, while WoofSwap’s assets have risen by 38% to $746,700. Other dApps, including K9 Financial DAO, ChewySwap, DogSwap, and PunkSwap, have also recorded gains of over 30%.
Growing activity on Shibarium is a positive sign for Shiba Inu, as it highlights the utility of the layer-2 network. It also signals the project’s evolution from a typical meme coin to one with functional value.
Additional data from ShibariumScan shows a continued rise in both address count and transaction volume. The network has now completed over 1.13 billion transactions, while total addresses have surpassed 206 million. Recent days have also seen a noticeable uptick in daily transactions.

More data shows that more SHIB coins are being taken out of circulation through token burns. The daily burn rate rose by 30%, bringing the total coins in circulation to 594 trillion.
Shiba Inu price analysis

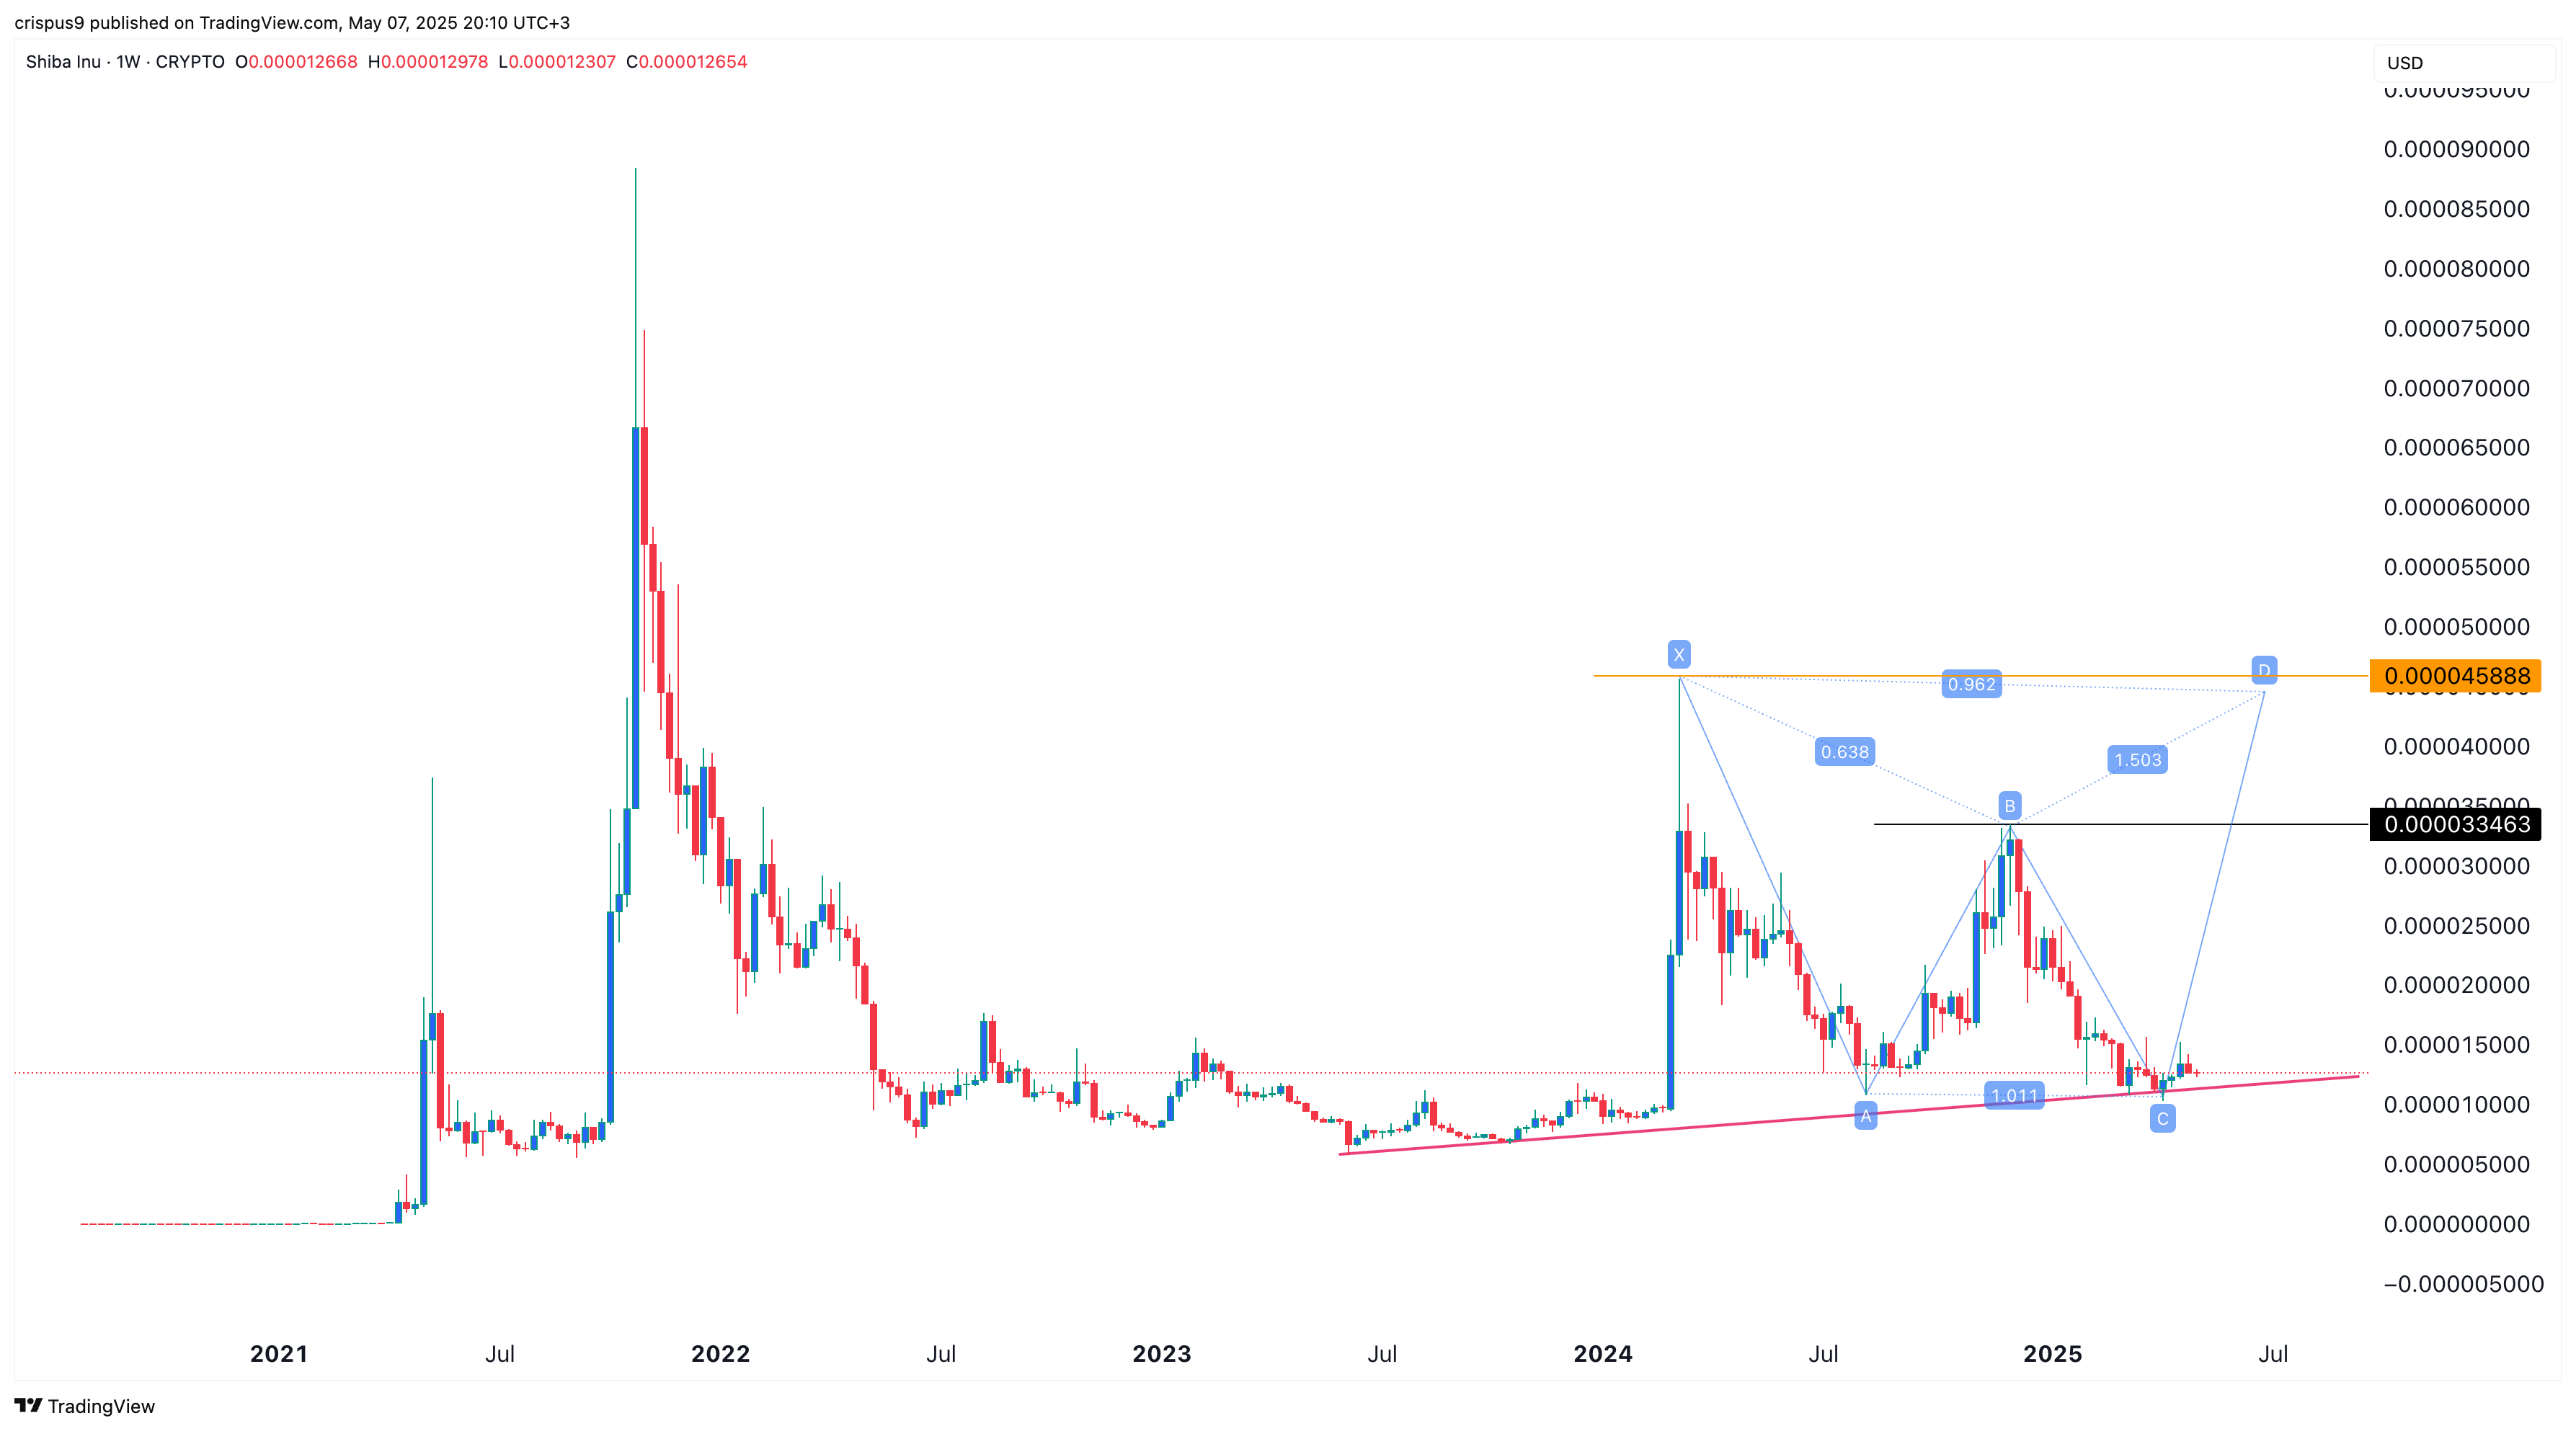
The weekly chart shows that SHIB has been in a sustained downtrend since peaking at $0.000033 in November last year. Despite this, the token remains above the ascending trendline that connects the lowest swing points since June 2023.
Shiba Inu has also formed a harmonic XABCD pattern that began in March 2023, when it peaked at $0.000045. The AB leg occurred between August and November, while the BC leg formed between November and April.
Therefore, the coin will likely jump to $0.000045, up by 265% from the current level. This forecast will likely take a few months or years to happen since it is based on the weekly chart.


