




XRP has slipped below $1.20 on Nov. 6, leaving its daily and weekly charts under pressure even as analysts point to whale accumulation and a possible bottoming pattern.
Summary
- XRP traded below four daily moving averages, with resistance concentrated around $1.27–$1.29.
- Weekly RSI stood at 42.84, below its average and the neutral 50 level.
- Alex Marzell identified $1.20 as the pivot separating a rebound from further losses.
- Ali Charts described negative sentiment alongside a potential inverse head-and-shoulders bottom.
The daily chart showed the token at $1.1936 at press time, with the session’s low at $1.1740. The daily candle was down 1.13%, while the weekly chart showed a 4.73% decline for the unfinished week.
XRP price loses ground after its recovery toward $1.30
The latest decline follows a rebound that briefly returned XRP above $1.30. As crypto.news previously reported, the token traded near $1.31 on Nov. 5 while analysts reported growing holdings among whales.
During that recovery, Ali Martinez estimated that whales had accumulated approximately 60 million XRP over the preceding week. Santiment separately reported that 2,147 wallets held at least 1 million XRP, its highest recorded count of 2026.
Such developments accompanied a recovery from the $1.25 area, but the latest chart places XRP below both levels. Measured against the previously reported $1.31 price, the Nov. 6 daily snapshot was roughly 8.9% lower.
Earlier in the week, XRP had traded near $1.25 despite 7,934 new XRP wallets being created on Nov. 1, according to Santiment figures cited in Nov. 3 coverage. Network growth and larger wallet balances have therefore coincided with price weakness.
U.S. fund demand had been uneven before the latest decline. Nov. 4 coverage of XRP’s recovery toward $1.30 cited SoSoValue figures showing $18.83 million in October ETF inflows, followed by $529,510 in net withdrawals on Nov. 2.
In a Nov. 6 post, crypto analyst Alex Marzell said XRP had lost $1.25 before reaching $1.20 overnight and slipping underneath it that morning.
“$1.20 is the level that decides it now,” he wrote.
His recovery scenario requires XRP to reclaim $1.20, bringing $1.22 back into view. Continued rejection at that level leaves $1.16 as his next downside reference, followed by $1.14 if selling carries the token lower.
XRP faces a recovery hurdle around $1.26–$1.29
On the daily chart, XRP sits below its 20-day simple moving average at $1.2855 and its 200-day SMA at $1.2720. Both averages are positioned above the immediate levels in Marzell’s rebound scenario.
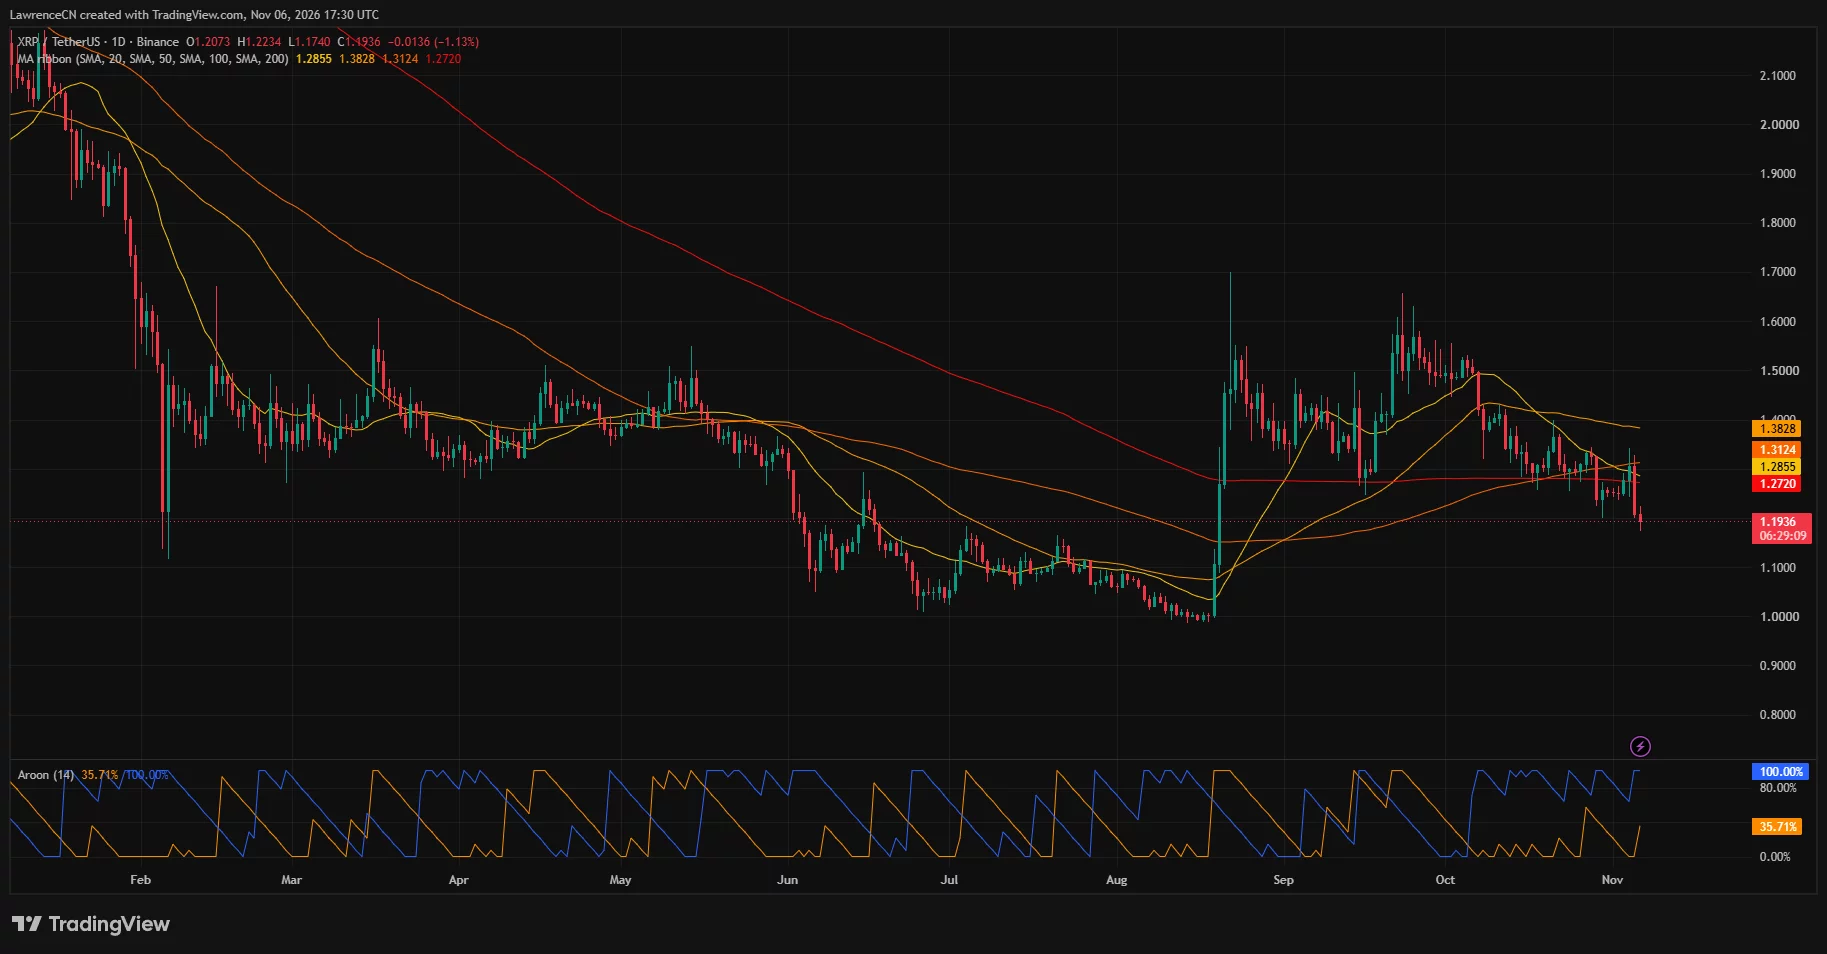
A recovery to $1.22 would consequently leave price underneath that resistance cluster. Farther overhead, the 100-day SMA stands at $1.3124, while the 50-day SMA is higher at $1.3828.
The price structure shows lower rally peaks following the late-September advance. November’s decline has brought XRP back toward levels last visited around the beginning of that recovery.
Daily Aroon readings reinforce the weakness. Aroon Down stands at 100%, against Aroon Up at 35.71%, indicating that the most recent low occurred more recently than the corresponding high within the indicator’s 14-period window.
The weekly chart adds another hurdle near the daily moving averages. Its Bollinger middle band stands at $1.2580, above the $1.1916 price displayed in the snapshot.
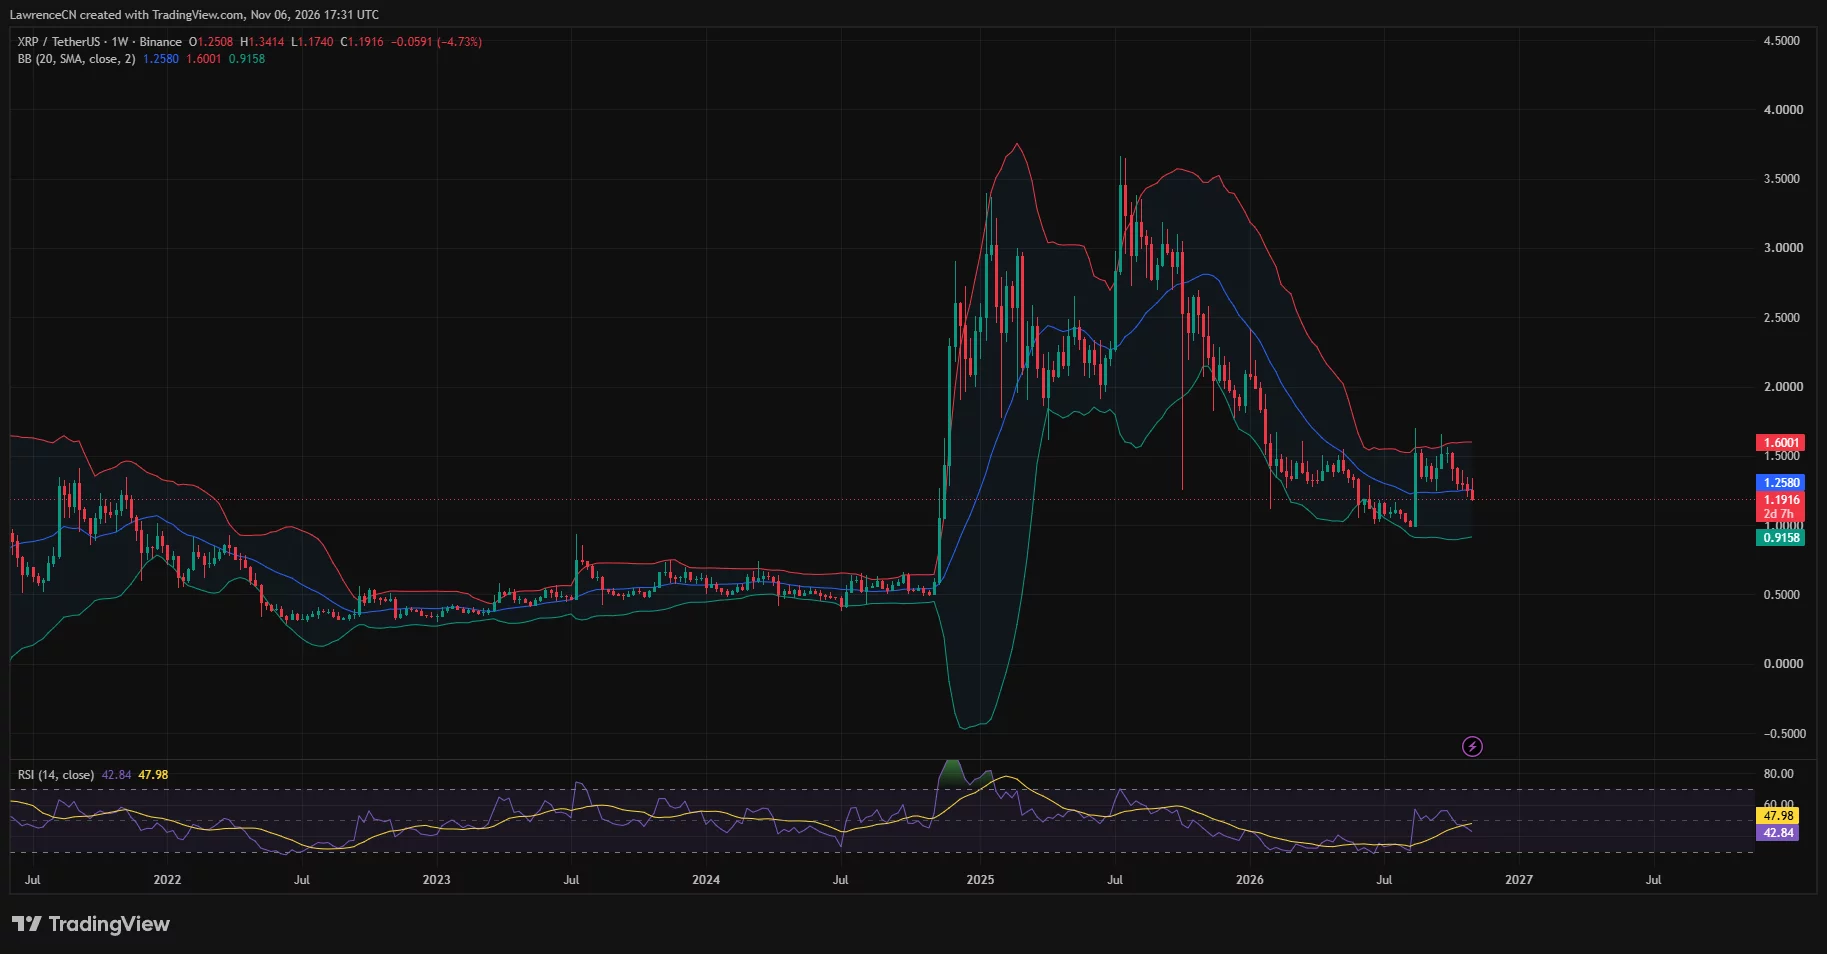
Weekly RSI reads 42.84, below its displayed average of 47.98. Although momentum remains below neutral, the reading is above the conventional oversold threshold of 30.
The weekly candle had reached $1.3414 before falling to $1.1740. With more than two days remaining when captured, its final close had not been established.
Bearish sentiment accompanies an unconfirmed bottoming thesis
Ali Charts offered a different perspective in his sentiment post, saying XRP’s social sentiment had dropped to its lowest level since July.
“The bullish trade may not be overcrowded yet,” the analyst wrote, describing a potential inverse head-and-shoulders bottom that he believed the crowd had not recognized.
His earlier Nov. 5 analysis identified a possible right shoulder and a neckline near $1.60. He placed $2.10 in focus only if XRP broke above that neckline and confirmed the pattern.
The weekly chart shows the September recovery stalling near $1.60 before the subsequent decline. Its upper Bollinger band currently sits at $1.6001, while the lower boundary stands at $0.9158.
Between the current price and that lower band lies the previous August base around $1.00, where XRP traded before its late-summer rebound.
Disclosure: This article does not represent investment advice. The content and materials featured on this page are for educational purposes only.
