




Aave price has climbed toward $182 after reaching an intraday high of $187.50 on Oct. 2, putting the $200 level within reach as daily momentum strengthens.
Summary
- $187.50 marks immediate resistance, with $200 next on the daily technical grid.
- Daily MACD remains positive, while the 4-hour ADX has climbed to 40.62.
- The liquidation heatmap shows a prominent overhead cluster near $188–$189.
- Aave’s existing buybacks send tokens to its reserve; a burn remains under consideration.
The advance follows late-September developments around a possible AAVE token burn and the launch of tokenized-stock collateral on Aave V4, while nearby resistance leaves room for a pullback before another breakout attempt.
Aave price approaches $200 after reclaiming $175
TradingView’s Binance AAVE/USDT daily chart showed the token at $181.66, up $10.22, or 5.96%, for the session at the time of capture. The recorded range stretched from $170.77 to $187.50, placing the price below its intraday peak after a strong move through $175.
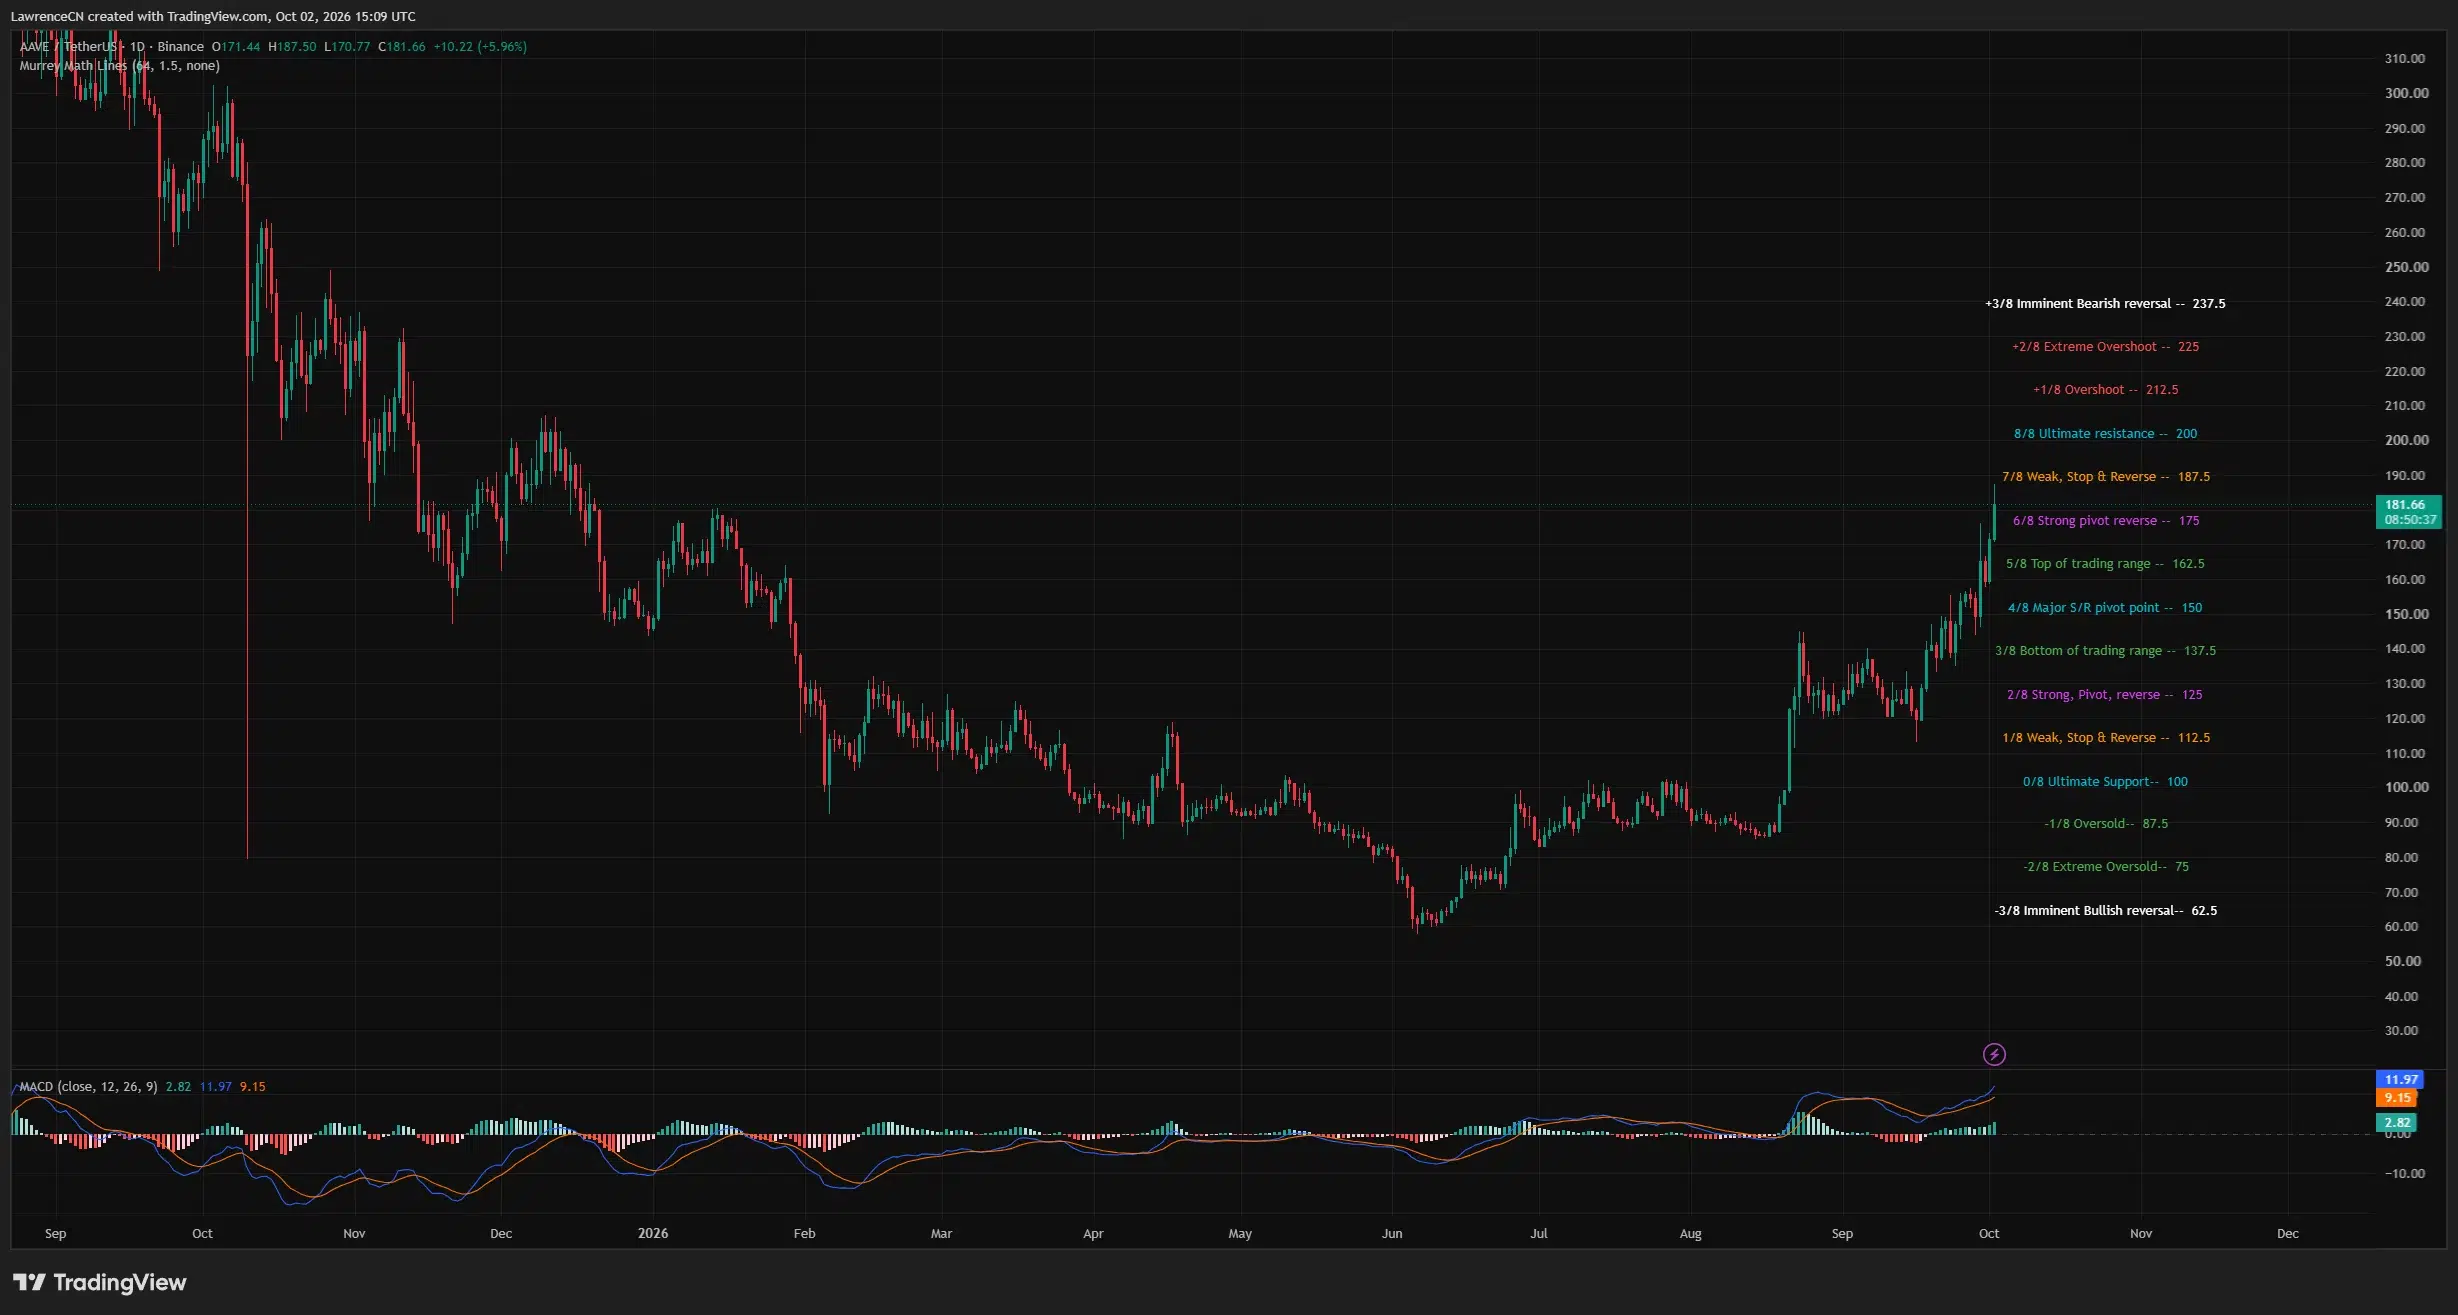
The daily structure shows a recovery from roughly $60 in June, followed by trading around $85–$100 during July and August. A late-August advance lifted AAVE above that range, while September brought another consolidation around $120–$140 before the latest push higher.
The sequence has created higher recovery lows and carried the token through several levels on the chart’s Murrey Math grid. AAVE now trades above $150, $162.50, and $175, leaving $187.50 as the next immediate barrier.
The session high reached that barrier exactly. A sustained move above $187.50 would open a technical path toward $200, roughly 10% above the daily chart’s recorded price. The $200 level also sits near a region where earlier rebounds stalled during the preceding decline.
Beyond $200, the grid places additional levels at $212.50 and $225. Both remain secondary upside scenarios that depend on AAVE first clearing nearby resistance and holding its breakout.
Daily MACD supports the upward price structure. The MACD line stood at 11.97, above the signal line at 9.15, with a positive histogram reading of 2.82. Both lines were above zero, and the histogram bars had expanded during the latest advance.
The combination gives the daily setup a bullish momentum bias, although the retreat from $187.50 shows that buyers still face selling near the next grid level. A daily close above that resistance would provide stronger confirmation than an intraday touch.
On a retracement, $175 becomes the first daily level to monitor. Losing it would put $162.50 back into focus, followed by the larger $150 pivot. A decline through that sequence would weaken the latest breakout and return AAVE toward its previous trading area.
The 4-hour trend remains strong above $168
The Binance 4-hour chart showed AAVE at $182.08, with the latest price bar down 0.97%. The pullback followed a sharp advance into the upper $180s, while the moving-average ribbon remained beneath the market.
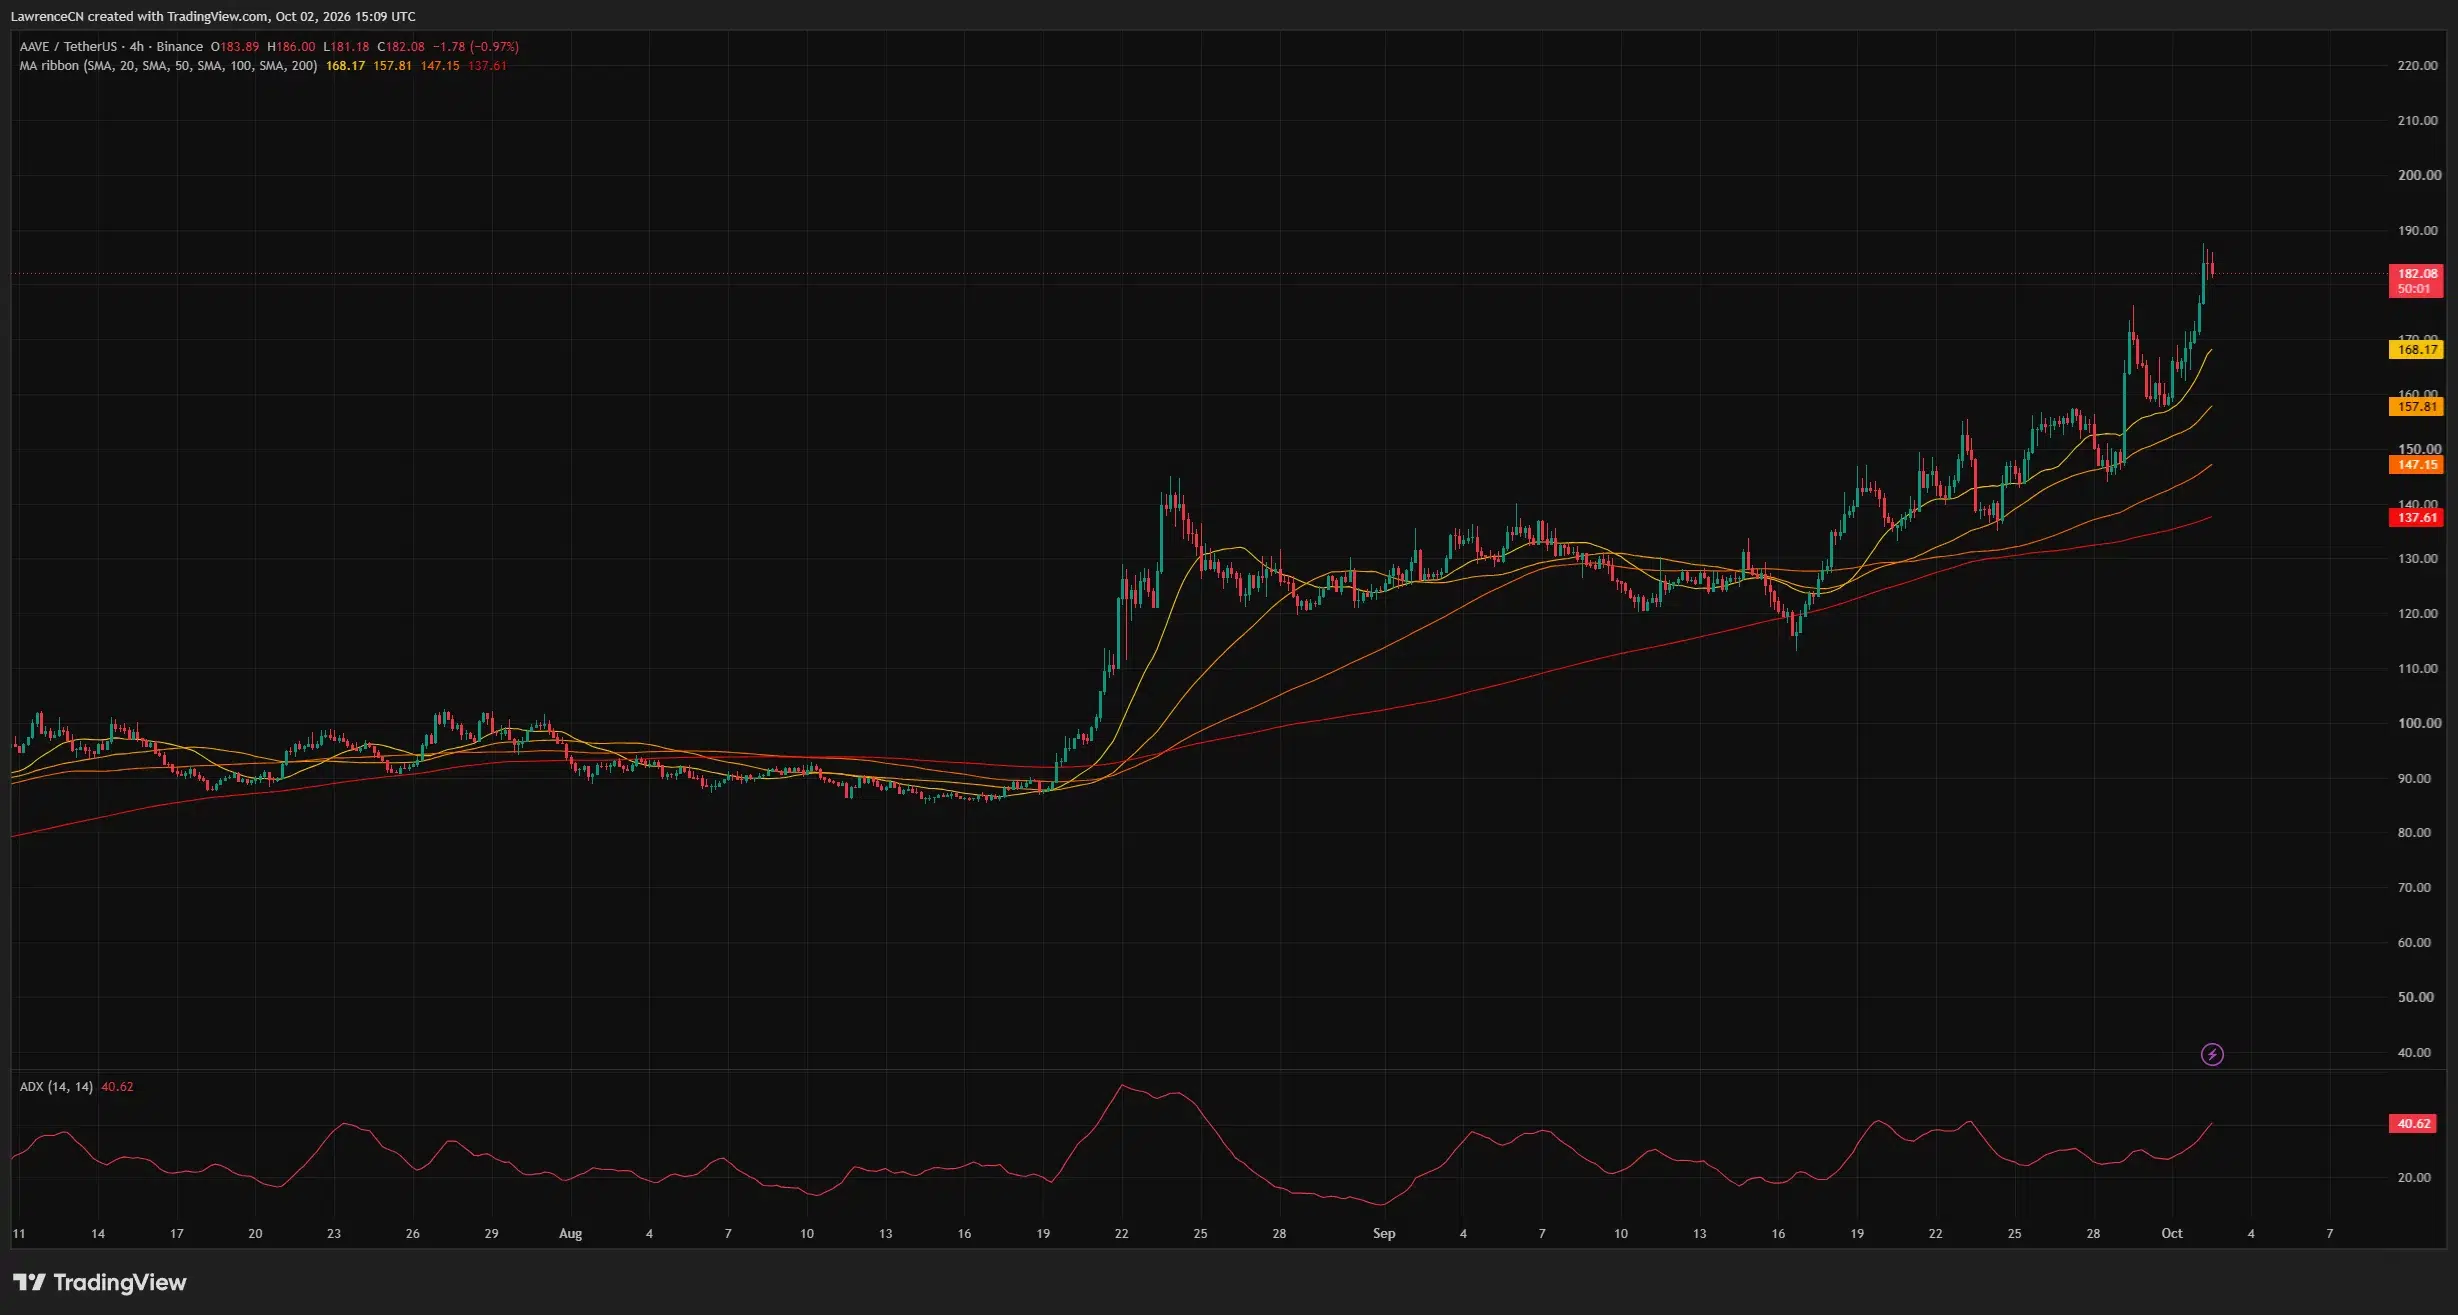
The 20-period simple moving average stood at $168.17, the 50-period average at $157.81, the 100-period average at $147.15, and the 200-period average at $137.61. Each shorter average remained above the next longer one, creating a bullish alignment across the ribbon.
Price was roughly 8.3% above the 20-period average. That gap measures how far the latest rally has carried AAVE from its nearest moving-average reference and gives a concrete level to watch if the pullback deepens.
The chart also shows the recovery continuing after a mid-September retreat toward $115–$120. Subsequent advances lifted AAVE into the $140s and $150s, followed by a late-September move toward $170 and the latest test near $187.50.
ADX stood at 40.62 and was rising at the right edge of the chart. The reading supports a strong trend, while the upward price structure and moving-average alignment establish its bullish direction.
A shallow retreat that stays above the recent $175 breakout area would preserve the latest upward leg. A larger decline toward $168.17 would test the shortest moving average, which has turned higher beneath the rally.
Below that average, $157.81 becomes the next ribbon reference. The longer averages at $147.15 and $137.61 mark deeper support tests rather than the immediate downside path. A move through the shorter averages would show that the current advance is losing strength before those lower levels come into play.
Liquidation clusters place $188–$189 above the market
CoinGlass’s 24-hour AAVE liquidation heatmap shows price advancing from the mid-$160s into the upper $180s before settling around $182. The strongest visible overhead band sits near $188–$189, with further clusters around $190 and $192–$194.
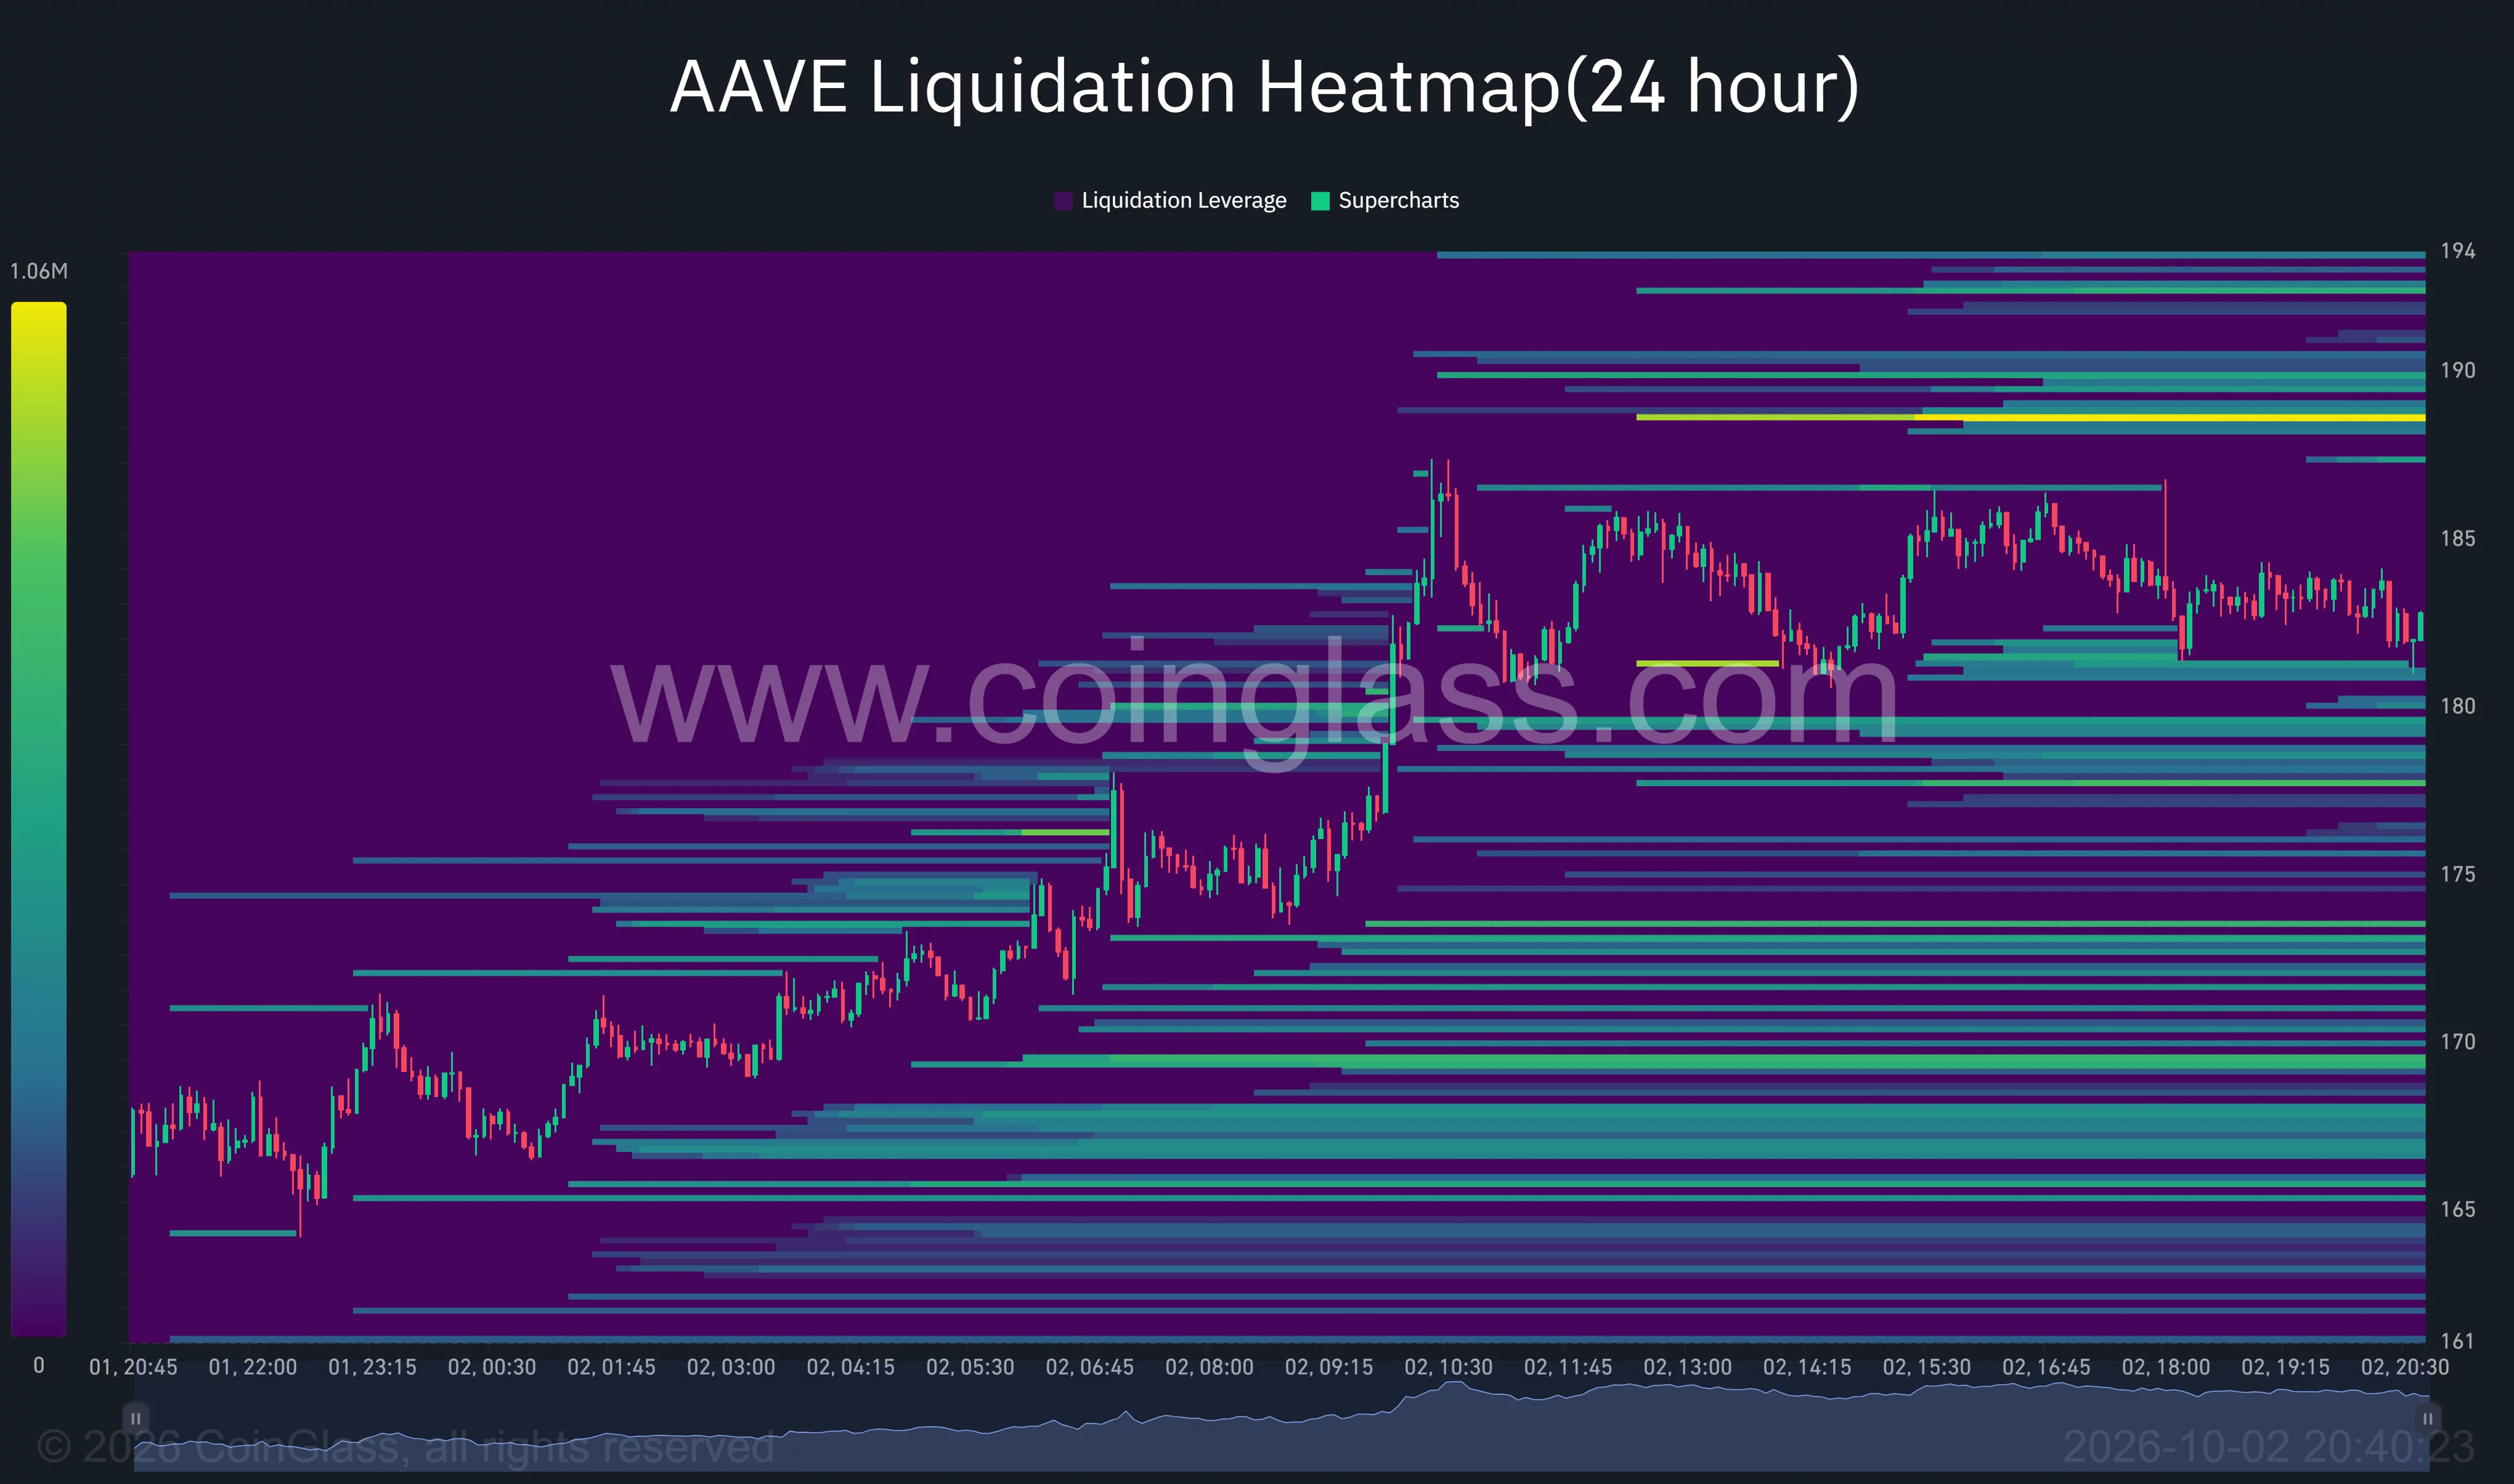
The nearest prominent overhead band lies just above the daily chart’s $187.50 resistance. A breakout through that area could expose leveraged short positions to liquidation, adding forced buying if price reaches their estimated liquidation levels.
Below the market, visible clusters sit around $181–$182 and $178–$180. Further concentrations appear near $173–$174 and $169–$170, with a broad lower band around $167–$168.
The lower clusters map areas where a decline could trigger liquidations of leveraged long positions. A move below the nearby $181 area would bring the $178–$180 band into focus before the deeper concentrations.
The upper-$160s band also lies close to the 4-hour 20-period average. A retreat into that region would therefore test both a moving-average reference and an area of estimated liquidation exposure.
The heatmap leaves potential liquidation pressure on both sides of the market. The bullish scenario requires price to clear overhead resistance, while the downside scenario begins with a loss of the nearby lower bands.
Burn discussions follow Aave’s tokenized-stock launch
Aave founder Stani Kulechov said on Sep. 28 that a burn was under consideration for Aavenomics 3.0.
“We’re considering also burn for Aavenomics 3.0”
Aave’s documentation states that its existing revenue-funded buyback program has a $50 million annual budget. Weekly purchases range from $250,000 to $1.75 million, and acquired AAVE goes to the DAO’s Ecosystem Reserve for governance-approved uses rather than being burned.
The proposed change would alter what happens to repurchased tokens. Permanent destruction would remove them from supply, while the current reserve model retains them for uses including staking rewards, grants and service-provider payments.
Separately, Aave Labs announced on Sep. 25 that seven Coinbase tokenized stocks had become collateral on Aave V4 on Base. The market lets eligible users borrow USDC against tokenized exposure to Apple, Amazon, Alphabet, Meta, Microsoft, Nvidia and Tesla.
For U.S. readers, access remains a key distinction: Aave Labs says the stock tokens are offered under Regulation S to eligible non-U.S. persons in permitted jurisdictions. The launch adds U.S. equity collateral to the protocol, while excluding U.S. users from those tokenized securities.
Analysts look beyond $200 as the near-term test tightens
Michaël van de Poppe wrote in an Oct. 1 post that AAVE’s current rise resembled the buildup before its late-2024 breakout toward $400. He said he would not be surprised by a similar period in the fourth quarter, framing the comparison as his outlook rather than an established price target.
Crypto Patel offered a more ambitious longer-term scenario, identifying $208, $355 and $1,000 as targets in a separate post. His analysis described a rounding-bottom structure on the two-week chart and identified $128 as a level that had turned into support.
Those projections extend far beyond the immediate resistance visible on the daily and 4-hour charts. The current technical test remains $187.50, followed by the overhead liquidation band near $188–$189 and the $200 daily level.
Holding $175 would preserve the latest daily breakout, while a retreat below it would shift attention toward $168 on the 4-hour chart and $162.50 on the daily grid. A sustained move above $187.50 would strengthen the case for another leg toward $200; a rejection followed by lost support would favor a deeper retracement.
Disclosure: This article does not represent investment advice. The content and materials featured on this page are for educational purposes only.
