




Bitcoin price has fallen 1.2% over the past 24 hours on October 20, as weak institutional demand and renewed selling has brought last week’s recovery to a standstill.
Summary
- Bitcoin price fell 1.2% to around $81,730 on October 20 as weak ETF demand and selling pressure prevented BTC from holding above $82,000.
- U.S. spot Bitcoin ETFs recorded roughly $228.6 million in weekly outflows, while concerns over inflation and the Federal Reserve’s next interest rate decision continued to weigh on the market.
- On the daily chart, the Ichimoku Cloud and Chaikin Money Flow indicators showed continued bearish pressure, with $81,144 and $80,000 emerging as important support levels.
- The four hour MACD showed signs of improving momentum, but Bitcoin needs to recover above $82,587 and then $83,457 to support a stronger recovery.
According to crypto.news data, BTC traded at $81,730.70 at the reporting snapshot, after falling from levels near $83,000. It briefly dropped toward $81,200 before recovering, but subsequent attempts to hold above $82,000 have also failed.
Bitcoin’s latest decline follows a difficult start to October for the cryptocurrency as concerts over persistent U.S. inflation and uncertainty surrounding the Federal Reserve’s next interest rate decision weighing on investor sentiment.
As a result, BTC is now trading below several key resistance levels.
Bitcoin price is struggling due to weak demand
The lack of Institutional demand has become a major concern for Bitcoin investors. U.S. spot Bitcoin ETFs recorded approximately $228.6 million in net withdrawals over the past week.
The withdrawals followed nearly $681 million in outflows the week before, and although the pace of withdrawals have slowed, it goes to show that investors have consistently moved funds to other avenues.
In its October 19 market assessment, on-chain analytics firm Glassnode reported that the selling responsible for Bitcoin’s early October decline had slowed, but there isn’t enough counter demand from spot market participants and ETF investors to help spark a recovery.
The report found that perpetual futures traders have been the major driver behind the selling. Simultaneously, ETF trading volumes had also dropped below their usual range.
On the options market, traders were continuing to pay more to protect themselves against more downside with Glassnode noting that the 25-delta skew had risen. Typically, when this happens, it is a sign that traders are concerned about more downside.
On-chain activity had also fallen short over the same period, with transaction fees and transfer volumes dropping by approximately 10% each. Only active addresses remained relatively stable.
The latest figures followed Bitcoin’s October 19 recovery, when BTC briefly climbed above $82,000 despite widespread concerns about another market selloff.
Inflation and Fed uncertainty is scaring Bitcoin investors
Macroeconomic conditions have been the key driver that has complicated Bitcoin’s attempts to recover especially after September’s U.S. consumer price index rose 3.7%, just above the 3.6% market forecast.
The stronger inflation reading has hammered hopes that the Federal Reserve would be able to ease monetary policy in the coming months.
Bitcoin has remained sensitive to changing interest rate expectations, particularly when higher Treasury yields make interest bearing assets more attractive relative to cryptocurrencies.
The Federal Reserve’s next policy meeting is scheduled for October 27 and 28, leaving investors with another important event to look up to before committing fresh capital into the market.
A number of additional U.S. economic and corporate developments are also on the watchlist. The October 19 to 23 economic calendar includes earnings from Tesla and Meta, weekly jobless claims and U.S. oil inventory figures, all of which could have an impact on market sentiment.
Past crypto.news analysis had already identified $82,000 as an important level that must be held or else there’s a chance the flagship crypto could slip towards $76,000 if selling pressure returned.
Bitcoin remains at risk on the daily chart
When examining the daily BTC/USD price chart, it is evident that selling pressure has not fully subsided, despite the cryptocurrency’s attempts to stabilize above $81,000.
On the daily Ichimoku Cloud indicator, BTC was trading near $81,705, which is below the Tenkan-sen at $81,974 and the Kijun-sen at $83,457. With the Tenkan-sen below the Kijun-sen, bearish momentum continues to dominate the daily trend. See below.
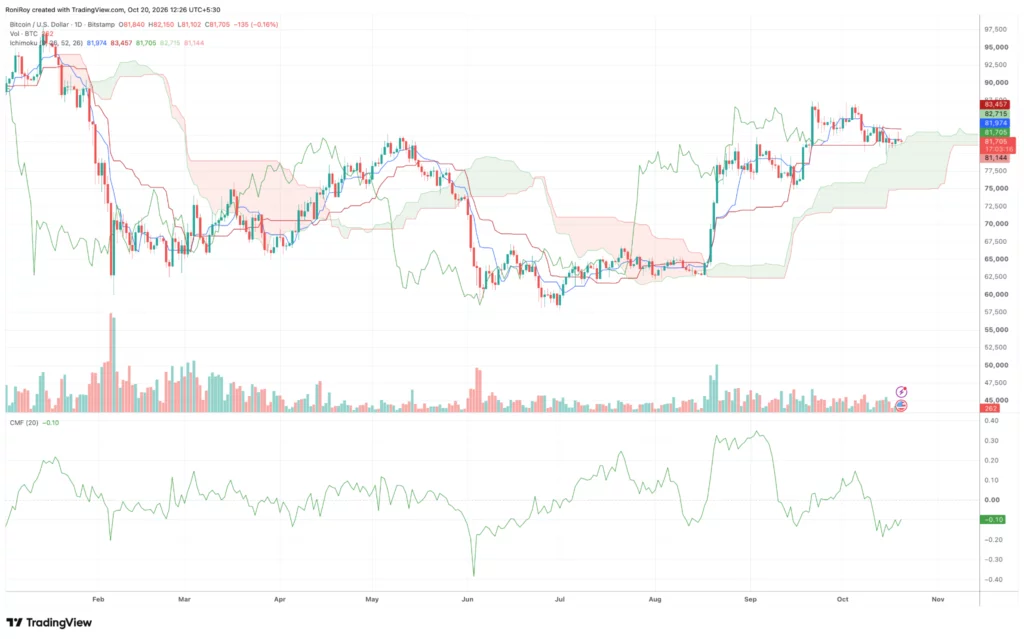
At press time, Bitcoin was testing the lower portion of the Ichimoku Cloud, with a nearby boundary around $81,144. If it falls below that level it would expose the $80,000 psychological support level, followed by the $77,500 to $78,000 range if selling pressure continues.
If Bitcoin manages to recover above $81,974, that would be the first sign of improvement, although the Kijun-sen near $83,457 remains the primary….f .
The Chaikin Money Flow indicator was registering a reading of negative 0.10 on the daily chart. A negative CMF indicates that selling pressure has outweighed buying pressure over the indicator’s measurement period.
Meanwhile,other technical indicators for Bitcoin showed a mixed picture, with the 14-day relative strength index near 47.69, indicating neutral momentum, while the exponential moving average composite retained a bullish reading.
Short-term chart remains slightly positive
On the 4-hour chart, however, Bitcoin was showing very early signs of improving momentum.
The Moving Average Convergence Divergence indicator recorded a MACD line of negative 31 and a signal line of negative 76, with the histogram at positive 45. See below.
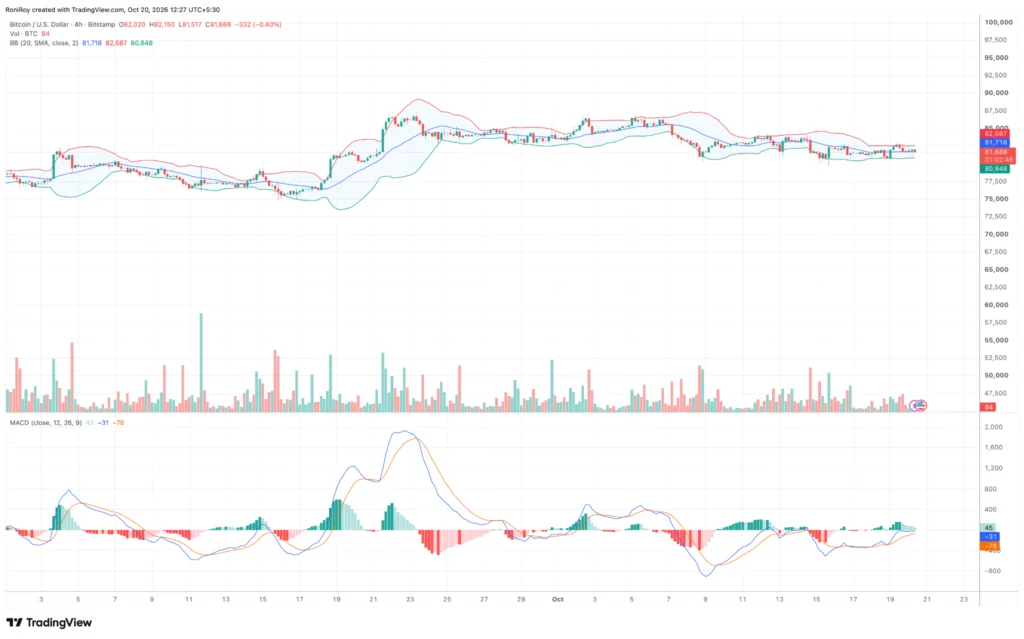
The MACD line had crossed above the signal line, indicating that short-term bearish momentum was easing. However, both lines remained below the zero level, suggesting that the improvement was still taking place within a weakened market structure.
Bitcoin was trading near $81,688, slightly below the middle Bollinger Band at $81,718. The upper band was at $82,587, while the lower band was at $80,848. A sustained recovery above $81,718 could open the way for another test of $82,587, particularly if the MACD histogram continues improving.
Beyond that level, buyers could face resistance around $83,457, corresponding to the daily Ichimoku Kijun-sen.
On the downside, failing to reclaim the middle Bollinger Band could bring the lower band at $80,848 back into focus.
A break below that area would put the $80,000 level under pressure, with the $77,500 to $78,000 region becoming a possible lower target if selling accelerates.
Analysts at Bitfinex have previously identified $81,300 as an important resistance level that had turned into support. According to the them, Bitcoin needs to recover above $84,000 to restore its upward momentum. This area was lost during the first week of October.
Disclosure: This article does not represent investment advice. The content and materials featured on this page are for educational purposes only.
