




Crypto’s 200 largest assets have gained just 5% since October 2021 even as annual new token supply has fallen from 26.5% to 3.3%, leaving the market roughly 35% below its long term trend, according to crypto market analyst Jamie Coutts.
Summary
- Crypto’s Top 200 has gained just 5% since October 2021 and remains roughly 35% below its long term trend, according to Jamie Coutts.
- Annual new token supply growth has fallen from 26.5% to 3.3%, while payouts to token holders have risen fivefold.
- Crypto projects spent approximately $638 million on token buybacks through August 2026, compared with $545 million during all of 2025.
- Altcoin market capitalization has gained around 45% since June, while 87% of Binance listed altcoins were trading above their 200 day moving averages by late September.
- Bitcoin ETF demand has remained stronger than other crypto funds, with flows into Ether and Solana products slowing after stronger September inflows.
According to Coutts, the market cap weighted Top 200 has effectively gone nowhere over the past five years despite major changes in token issuance and how value is returned to holders. His analysis placed the market roughly 35% below a long run trend that has grown at around 35% a year since 2017.
“Supply ate the demand,” Coutts wrote, pointing to years of token issuance that diluted existing holders even as crypto adoption grew.
According to Coutts, new supply growth has since dropped to 3.3% a year from 26.5%, while payouts to token holders have risen fivefold. Demand is beginning to turn higher at the same time, forming what he described as crypto’s “payback era.”
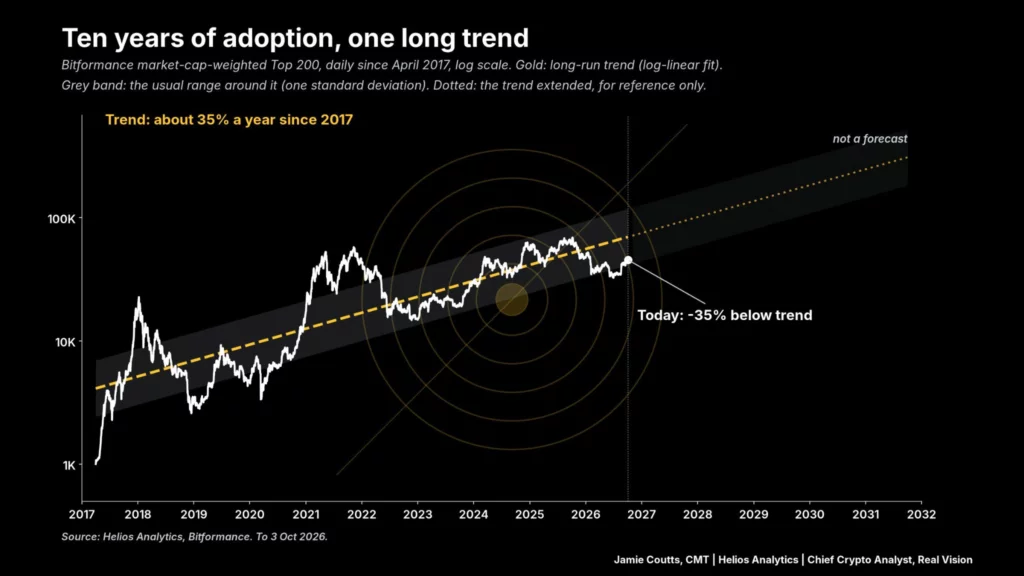
His chart, based on Bitformance’s market cap weighted Top 200 and daily data going back to April 2017, uses a log linear fit to track the market’s long run path. The 35% gap represents the distance from that historical trend, with the chart explicitly stating that its extension is not a forecast.
Crypto token supply has slowed as buybacks grow
Supply pressure has been a persistent issue outside Bitcoin, with tokens entering circulation through emissions, investor vesting schedules and team allocations.
Coutts examined 309 tokens that had entered the Top 100 by market capitalization at least once since 2021 and found that annual tokenomics changes favorable to holders had risen from 10 in 2021 and 2022 to 32 currently. The changes included token burns, buybacks, fee distributions and cuts to emissions.
Crypto projects spent approximately $638 million on token buybacks between the start of 2026 and Aug. 31, according to Allium Labs data cited by the Financial Times, crypto.news previously reported. The comparable figure for 2025 was $545 million, while tracked purchases totaled only $366,000 in 2024.
Hyperliquid and Pump.fun accounted for nearly 90% of the 2026 total. Hyperliquid routes eligible trading fees into HYPE purchases through its Assistance Fund, while Pump.fun uses revenue from its products to repurchase PUMP.
Jito has proposed directing 100% of its share of JTX revenue toward JTO buybacks and burns through at least the fourth quarter of 2027. BitTorrent introduced a program in July that allocates revenue from its decentralized services to quarterly BTT purchases and permanent burns.
Token unlocks remain a source of new supply, while weaker demand can outweigh purchases funded by protocol revenue. The effect of buybacks depends on their size, available protocol revenue and whether purchased tokens are burned or held by a treasury.
Altcoin market breadth has recovered from June lows
Demand across the altcoin market has improved in recent months, though gains remain uneven.
By Sept. 27, altcoin market capitalization measured by TOTAL2 had added more than $371 billion since June to reach roughly $1.17 trillion. The share of Binance listed altcoins trading above their 200 day moving averages reached 87%, according to CryptoQuant analyst Darkfost.
At the end of June, 84% of the same group had been trading below their 200 day averages. Altcoin market capitalization gained around 45% over the period.
Aggregate open interest in altcoin perpetual futures surpassed Bitcoin open interest in early September for the first time since December 2024, while market capitalization outside the 10 largest crypto assets moved above $200 billion.
Coutts’ Top 200 measure covers a longer period spanning the 2021 market peak, the 2022 downturn and the subsequent recovery. Despite the recent improvement in altcoins, the index remains only 5% above its October 2021 level.
Bitcoin continues to account for a large share of the crypto market. On Oct. 5, total crypto market capitalization stood near $2.98 trillion while Bitcoin dominance was around 57%. CryptoQuant data found Bitcoin’s apparent demand improved by roughly 81,000 BTC between Sept. 24 and Oct. 1, although the measure remained negative.
ETF demand remains concentrated in Bitcoin
U.S. spot Bitcoin ETFs attracted $2.39 billion during the week of Sept. 21 to 25. Ether ETFs attracted $689.8 million during the same week, while Solana funds received $188.1 million.
Flows slowed the following week, with provisional figures for Sept. 28 through Oct. 2 showing $82.9 million entering Bitcoin funds. Ether funds recorded $118 million in net outflows during the same period, while Solana ETF inflows dropped to $800,000 and Hyperliquid funds received $3.4 million.
The figures point to uneven demand across crypto investment products at a time when Coutts sees token supply becoming less dilutive. Lower issuance reduces the amount of new supply entering circulation, but sustained demand remains another part of the equation.
